Immigrants from Zimbabwe vs Hispanic or Latino Male Poverty
COMPARE
Immigrants from Zimbabwe
Hispanic or Latino
Male Poverty
Male Poverty Comparison
Immigrants from Zimbabwe
Hispanics or Latinos
10.5%
MALE POVERTY
92.0/ 100
METRIC RATING
101st/ 347
METRIC RANK
13.9%
MALE POVERTY
0.0/ 100
METRIC RATING
294th/ 347
METRIC RANK
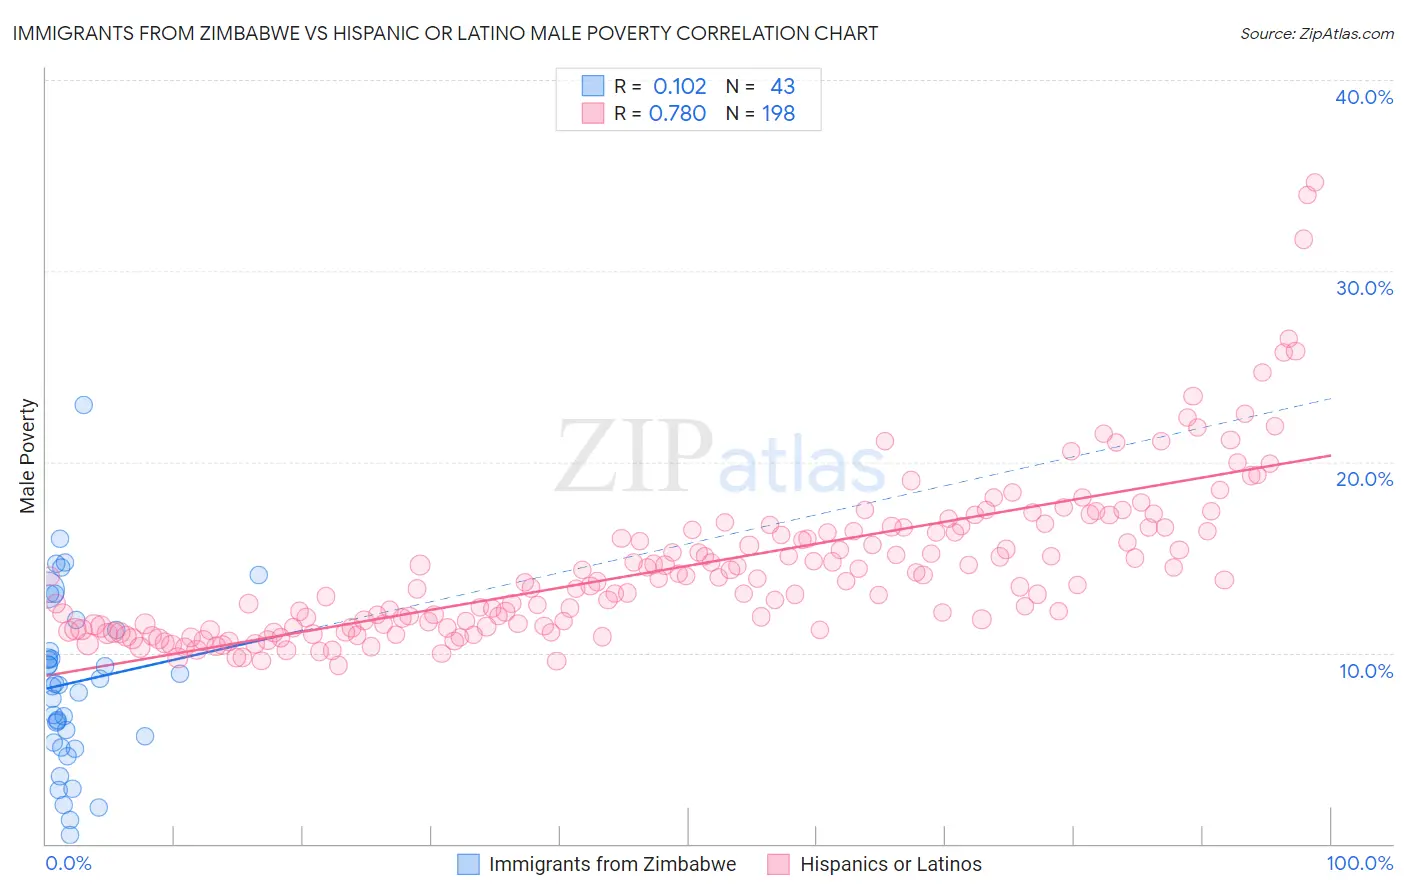
Immigrants from Zimbabwe vs Hispanic or Latino Male Poverty Correlation Chart
The statistical analysis conducted on geographies consisting of 117,776,371 people shows a poor positive correlation between the proportion of Immigrants from Zimbabwe and poverty level among males in the United States with a correlation coefficient (R) of 0.102 and weighted average of 10.5%. Similarly, the statistical analysis conducted on geographies consisting of 573,631,780 people shows a strong positive correlation between the proportion of Hispanics or Latinos and poverty level among males in the United States with a correlation coefficient (R) of 0.780 and weighted average of 13.9%, a difference of 31.7%.
Male Poverty Correlation Summary
| Measurement | Immigrants from Zimbabwe | Hispanic or Latino |
| Minimum | 0.44% | 9.3% |
| Maximum | 23.0% | 34.6% |
| Range | 22.5% | 25.3% |
| Mean | 8.4% | 14.5% |
| Median | 8.3% | 13.7% |
| Interquartile 25% (IQ1) | 5.3% | 11.3% |
| Interquartile 75% (IQ3) | 11.2% | 16.4% |
| Interquartile Range (IQR) | 5.8% | 5.1% |
| Standard Deviation (Sample) | 4.6% | 4.2% |
| Standard Deviation (Population) | 4.5% | 4.2% |
Similar Demographics by Male Poverty
Demographics Similar to Immigrants from Zimbabwe by Male Poverty
In terms of male poverty, the demographic groups most similar to Immigrants from Zimbabwe are French Canadian (10.5%, a difference of 0.010%), Slavic (10.5%, a difference of 0.11%), Welsh (10.5%, a difference of 0.12%), Canadian (10.5%, a difference of 0.13%), and Immigrants from Southern Europe (10.5%, a difference of 0.24%).
| Demographics | Rating | Rank | Male Poverty |
| Immigrants | South Africa | 94.1 /100 | #94 | Exceptional 10.4% |
| Scottish | 94.0 /100 | #95 | Exceptional 10.4% |
| Immigrants | Egypt | 93.7 /100 | #96 | Exceptional 10.4% |
| Romanians | 93.6 /100 | #97 | Exceptional 10.5% |
| Finns | 93.4 /100 | #98 | Exceptional 10.5% |
| Immigrants | Indonesia | 93.3 /100 | #99 | Exceptional 10.5% |
| Immigrants | Latvia | 92.8 /100 | #100 | Exceptional 10.5% |
| Immigrants | Zimbabwe | 92.0 /100 | #101 | Exceptional 10.5% |
| French Canadians | 91.9 /100 | #102 | Exceptional 10.5% |
| Slavs | 91.7 /100 | #103 | Exceptional 10.5% |
| Welsh | 91.6 /100 | #104 | Exceptional 10.5% |
| Canadians | 91.6 /100 | #105 | Exceptional 10.5% |
| Immigrants | Southern Europe | 91.3 /100 | #106 | Exceptional 10.5% |
| Laotians | 91.2 /100 | #107 | Exceptional 10.5% |
| Portuguese | 91.0 /100 | #108 | Exceptional 10.6% |
Demographics Similar to Hispanics or Latinos by Male Poverty
In terms of male poverty, the demographic groups most similar to Hispanics or Latinos are Immigrants from Belize (13.8%, a difference of 0.060%), Indonesian (13.8%, a difference of 0.070%), Vietnamese (13.8%, a difference of 0.24%), Immigrants from Central America (13.9%, a difference of 0.28%), and Immigrants from Zaire (13.8%, a difference of 0.32%).
| Demographics | Rating | Rank | Male Poverty |
| Immigrants | Barbados | 0.0 /100 | #287 | Tragic 13.8% |
| Immigrants | St. Vincent and the Grenadines | 0.0 /100 | #288 | Tragic 13.8% |
| Guatemalans | 0.0 /100 | #289 | Tragic 13.8% |
| Immigrants | Zaire | 0.0 /100 | #290 | Tragic 13.8% |
| Vietnamese | 0.0 /100 | #291 | Tragic 13.8% |
| Indonesians | 0.0 /100 | #292 | Tragic 13.8% |
| Immigrants | Belize | 0.0 /100 | #293 | Tragic 13.8% |
| Hispanics or Latinos | 0.0 /100 | #294 | Tragic 13.9% |
| Immigrants | Central America | 0.0 /100 | #295 | Tragic 13.9% |
| Cajuns | 0.0 /100 | #296 | Tragic 13.9% |
| Inupiat | 0.0 /100 | #297 | Tragic 14.0% |
| Blackfeet | 0.0 /100 | #298 | Tragic 14.0% |
| Immigrants | Guatemala | 0.0 /100 | #299 | Tragic 14.0% |
| Immigrants | Mexico | 0.0 /100 | #300 | Tragic 14.0% |
| Immigrants | Senegal | 0.0 /100 | #301 | Tragic 14.0% |