Immigrants from Asia vs Slavic Male Poverty
COMPARE
Immigrants from Asia
Slavic
Male Poverty
Male Poverty Comparison
Immigrants from Asia
Slavs
10.2%
MALE POVERTY
97.0/ 100
METRIC RATING
73rd/ 347
METRIC RANK
10.5%
MALE POVERTY
91.7/ 100
METRIC RATING
103rd/ 347
METRIC RANK
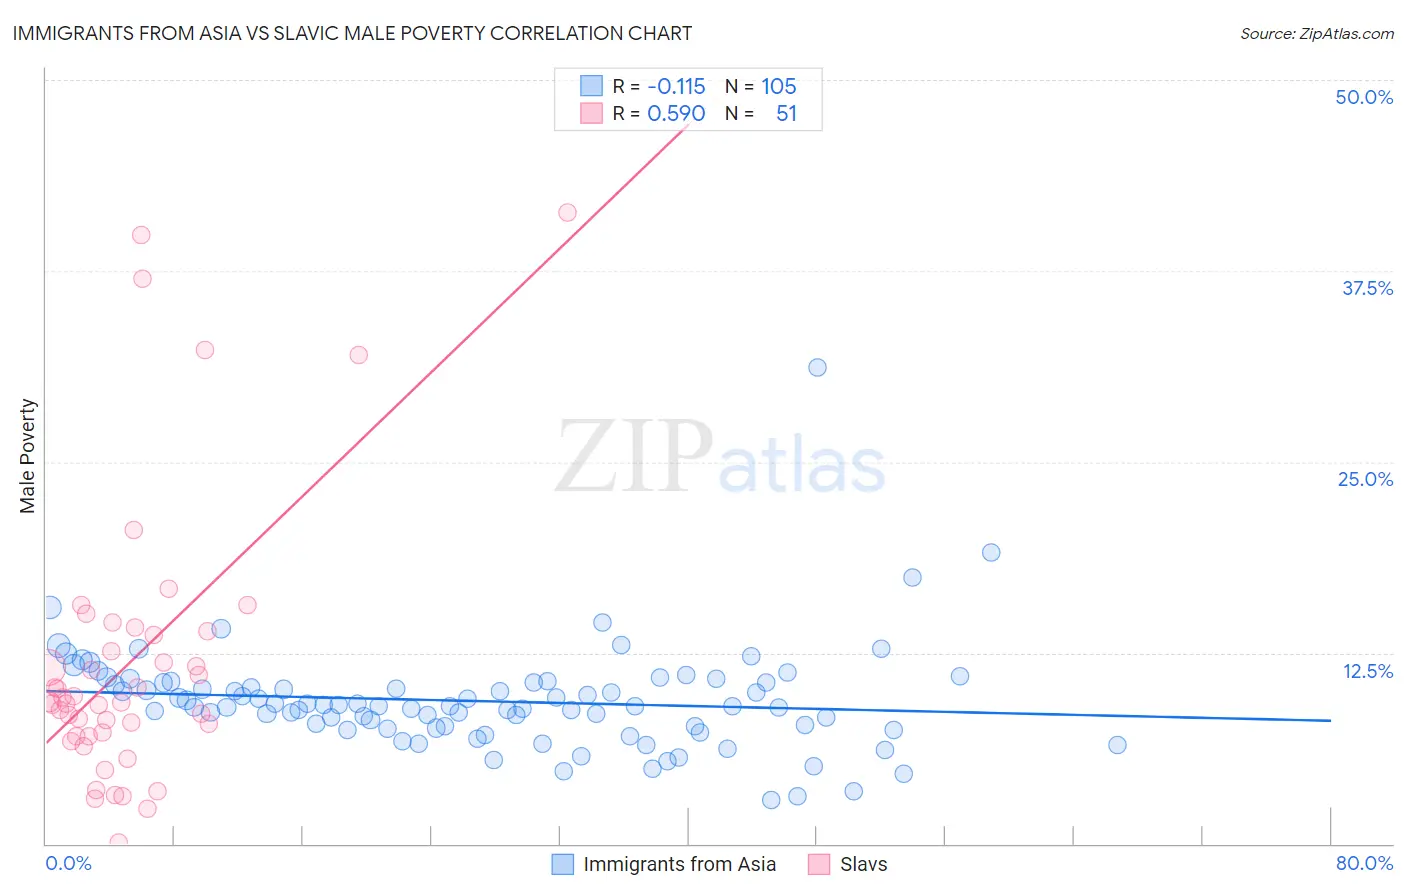
Immigrants from Asia vs Slavic Male Poverty Correlation Chart
The statistical analysis conducted on geographies consisting of 547,932,841 people shows a poor negative correlation between the proportion of Immigrants from Asia and poverty level among males in the United States with a correlation coefficient (R) of -0.115 and weighted average of 10.2%. Similarly, the statistical analysis conducted on geographies consisting of 270,742,219 people shows a substantial positive correlation between the proportion of Slavs and poverty level among males in the United States with a correlation coefficient (R) of 0.590 and weighted average of 10.5%, a difference of 2.9%.
Male Poverty Correlation Summary
| Measurement | Immigrants from Asia | Slavic |
| Minimum | 2.8% | 0.066% |
| Maximum | 31.2% | 41.3% |
| Range | 28.3% | 41.2% |
| Mean | 9.3% | 11.9% |
| Median | 9.0% | 9.3% |
| Interquartile 25% (IQ1) | 7.6% | 7.0% |
| Interquartile 75% (IQ3) | 10.6% | 13.9% |
| Interquartile Range (IQR) | 3.0% | 6.9% |
| Standard Deviation (Sample) | 3.4% | 9.2% |
| Standard Deviation (Population) | 3.4% | 9.1% |
Similar Demographics by Male Poverty
Demographics Similar to Immigrants from Asia by Male Poverty
In terms of male poverty, the demographic groups most similar to Immigrants from Asia are Immigrants from Eastern Europe (10.2%, a difference of 0.070%), Immigrants from Canada (10.2%, a difference of 0.080%), Carpatho Rusyn (10.2%, a difference of 0.080%), Dutch (10.2%, a difference of 0.080%), and European (10.2%, a difference of 0.090%).
| Demographics | Rating | Rank | Male Poverty |
| Serbians | 97.5 /100 | #66 | Exceptional 10.2% |
| Immigrants | Netherlands | 97.3 /100 | #67 | Exceptional 10.2% |
| Immigrants | Sri Lanka | 97.2 /100 | #68 | Exceptional 10.2% |
| Immigrants | Australia | 97.1 /100 | #69 | Exceptional 10.2% |
| Paraguayans | 97.1 /100 | #70 | Exceptional 10.2% |
| Europeans | 97.1 /100 | #71 | Exceptional 10.2% |
| Immigrants | Canada | 97.1 /100 | #72 | Exceptional 10.2% |
| Immigrants | Asia | 97.0 /100 | #73 | Exceptional 10.2% |
| Immigrants | Eastern Europe | 96.9 /100 | #74 | Exceptional 10.2% |
| Carpatho Rusyns | 96.9 /100 | #75 | Exceptional 10.2% |
| Dutch | 96.9 /100 | #76 | Exceptional 10.2% |
| Immigrants | Belgium | 96.8 /100 | #77 | Exceptional 10.3% |
| Irish | 96.8 /100 | #78 | Exceptional 10.3% |
| Immigrants | North America | 96.5 /100 | #79 | Exceptional 10.3% |
| English | 96.4 /100 | #80 | Exceptional 10.3% |
Demographics Similar to Slavs by Male Poverty
In terms of male poverty, the demographic groups most similar to Slavs are Welsh (10.5%, a difference of 0.010%), Canadian (10.5%, a difference of 0.020%), French Canadian (10.5%, a difference of 0.10%), Immigrants from Zimbabwe (10.5%, a difference of 0.11%), and Immigrants from Southern Europe (10.5%, a difference of 0.13%).
| Demographics | Rating | Rank | Male Poverty |
| Immigrants | Egypt | 93.7 /100 | #96 | Exceptional 10.4% |
| Romanians | 93.6 /100 | #97 | Exceptional 10.5% |
| Finns | 93.4 /100 | #98 | Exceptional 10.5% |
| Immigrants | Indonesia | 93.3 /100 | #99 | Exceptional 10.5% |
| Immigrants | Latvia | 92.8 /100 | #100 | Exceptional 10.5% |
| Immigrants | Zimbabwe | 92.0 /100 | #101 | Exceptional 10.5% |
| French Canadians | 91.9 /100 | #102 | Exceptional 10.5% |
| Slavs | 91.7 /100 | #103 | Exceptional 10.5% |
| Welsh | 91.6 /100 | #104 | Exceptional 10.5% |
| Canadians | 91.6 /100 | #105 | Exceptional 10.5% |
| Immigrants | Southern Europe | 91.3 /100 | #106 | Exceptional 10.5% |
| Laotians | 91.2 /100 | #107 | Exceptional 10.5% |
| Portuguese | 91.0 /100 | #108 | Exceptional 10.6% |
| Albanians | 90.6 /100 | #109 | Exceptional 10.6% |
| Argentineans | 90.1 /100 | #110 | Exceptional 10.6% |