Immigrants from Yemen vs Blackfeet Single Father Poverty
COMPARE
Immigrants from Yemen
Blackfeet
Single Father Poverty
Single Father Poverty Comparison
Immigrants from Yemen
Blackfeet
20.6%
SINGLE FATHER POVERTY
0.0/ 100
METRIC RATING
326th/ 347
METRIC RANK
18.5%
SINGLE FATHER POVERTY
0.0/ 100
METRIC RATING
305th/ 347
METRIC RANK
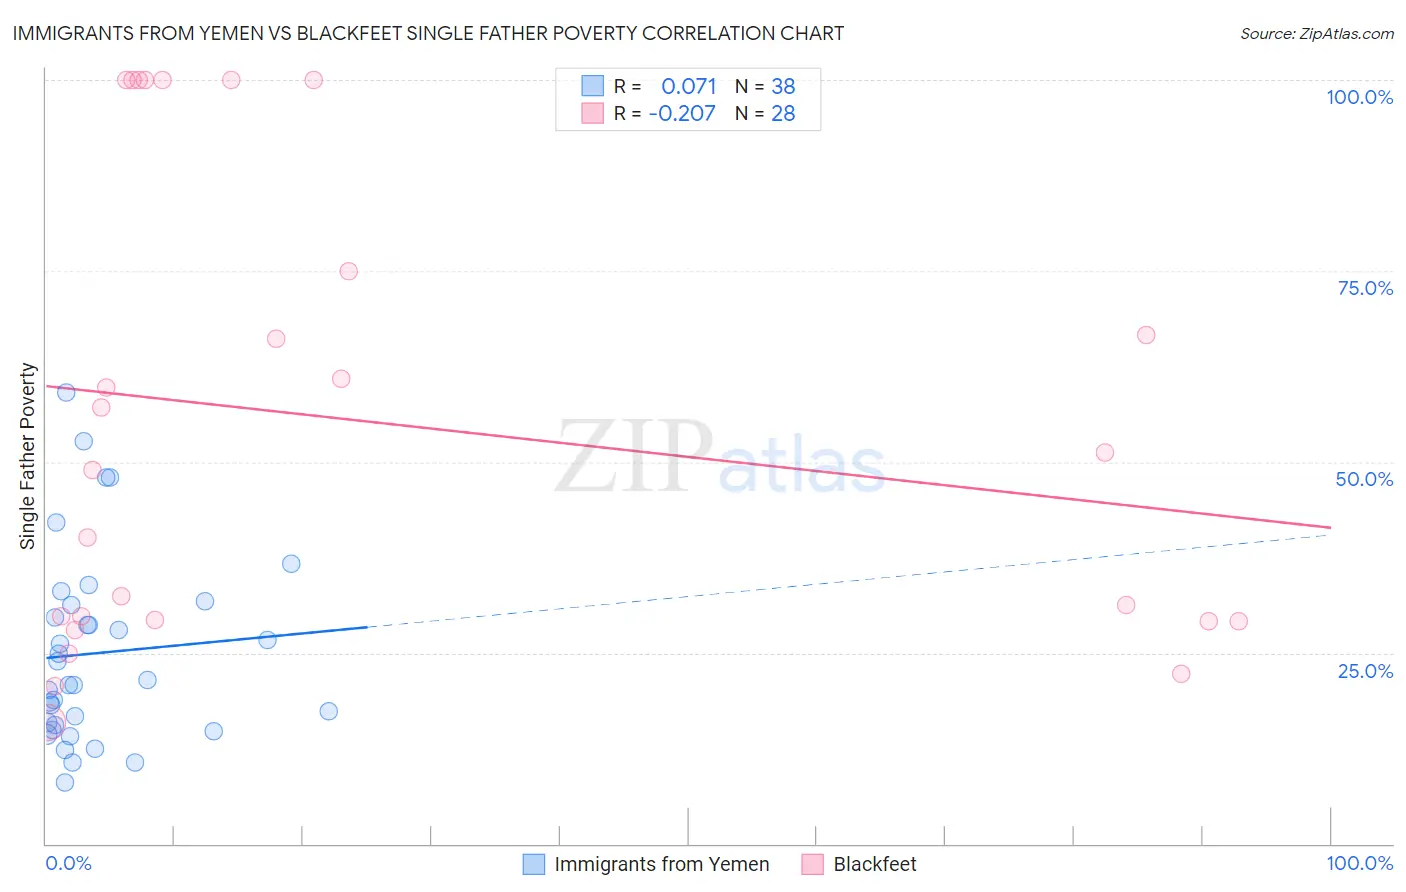
Immigrants from Yemen vs Blackfeet Single Father Poverty Correlation Chart
The statistical analysis conducted on geographies consisting of 76,647,654 people shows a slight positive correlation between the proportion of Immigrants from Yemen and poverty level among single fathers in the United States with a correlation coefficient (R) of 0.071 and weighted average of 20.6%. Similarly, the statistical analysis conducted on geographies consisting of 259,730,501 people shows a weak negative correlation between the proportion of Blackfeet and poverty level among single fathers in the United States with a correlation coefficient (R) of -0.207 and weighted average of 18.5%, a difference of 11.2%.
Single Father Poverty Correlation Summary
| Measurement | Immigrants from Yemen | Blackfeet |
| Minimum | 8.1% | 15.8% |
| Maximum | 59.1% | 100.0% |
| Range | 51.0% | 84.2% |
| Mean | 25.0% | 55.3% |
| Median | 21.1% | 50.0% |
| Interquartile 25% (IQ1) | 15.5% | 29.2% |
| Interquartile 75% (IQ3) | 31.3% | 87.5% |
| Interquartile Range (IQR) | 15.9% | 58.3% |
| Standard Deviation (Sample) | 12.4% | 30.4% |
| Standard Deviation (Population) | 12.2% | 29.8% |
Similar Demographics by Single Father Poverty
Demographics Similar to Immigrants from Yemen by Single Father Poverty
In terms of single father poverty, the demographic groups most similar to Immigrants from Yemen are Choctaw (20.7%, a difference of 0.69%), Black/African American (20.4%, a difference of 1.0%), American (20.1%, a difference of 2.6%), Pueblo (21.1%, a difference of 2.6%), and Pennsylvania German (20.0%, a difference of 2.8%).
| Demographics | Rating | Rank | Single Father Poverty |
| Slovaks | 0.0 /100 | #319 | Tragic 19.3% |
| Inupiat | 0.0 /100 | #320 | Tragic 19.5% |
| Cherokee | 0.0 /100 | #321 | Tragic 19.6% |
| Creek | 0.0 /100 | #322 | Tragic 19.8% |
| Pennsylvania Germans | 0.0 /100 | #323 | Tragic 20.0% |
| Americans | 0.0 /100 | #324 | Tragic 20.1% |
| Blacks/African Americans | 0.0 /100 | #325 | Tragic 20.4% |
| Immigrants | Yemen | 0.0 /100 | #326 | Tragic 20.6% |
| Choctaw | 0.0 /100 | #327 | Tragic 20.7% |
| Pueblo | 0.0 /100 | #328 | Tragic 21.1% |
| Colville | 0.0 /100 | #329 | Tragic 21.4% |
| Paiute | 0.0 /100 | #330 | Tragic 21.6% |
| Central American Indians | 0.0 /100 | #331 | Tragic 21.7% |
| Tohono O'odham | 0.0 /100 | #332 | Tragic 22.0% |
| Natives/Alaskans | 0.0 /100 | #333 | Tragic 22.4% |
Demographics Similar to Blackfeet by Single Father Poverty
In terms of single father poverty, the demographic groups most similar to Blackfeet are Ute (18.5%, a difference of 0.050%), Celtic (18.5%, a difference of 0.19%), Scotch-Irish (18.6%, a difference of 0.22%), Comanche (18.5%, a difference of 0.23%), and French Canadian (18.6%, a difference of 0.26%).
| Demographics | Rating | Rank | Single Father Poverty |
| Africans | 0.0 /100 | #298 | Tragic 18.3% |
| Whites/Caucasians | 0.0 /100 | #299 | Tragic 18.4% |
| Immigrants | Dominican Republic | 0.0 /100 | #300 | Tragic 18.4% |
| Hungarians | 0.0 /100 | #301 | Tragic 18.5% |
| Comanche | 0.0 /100 | #302 | Tragic 18.5% |
| Celtics | 0.0 /100 | #303 | Tragic 18.5% |
| Ute | 0.0 /100 | #304 | Tragic 18.5% |
| Blackfeet | 0.0 /100 | #305 | Tragic 18.5% |
| Scotch-Irish | 0.0 /100 | #306 | Tragic 18.6% |
| French Canadians | 0.0 /100 | #307 | Tragic 18.6% |
| Ottawa | 0.0 /100 | #308 | Tragic 18.6% |
| Immigrants | Micronesia | 0.0 /100 | #309 | Tragic 18.6% |
| Chippewa | 0.0 /100 | #310 | Tragic 18.8% |
| Immigrants | Nonimmigrants | 0.0 /100 | #311 | Tragic 18.8% |
| Immigrants | Dominica | 0.0 /100 | #312 | Tragic 18.9% |