Immigrants from Yemen vs Lumbee Single Father Poverty
COMPARE
Immigrants from Yemen
Lumbee
Single Father Poverty
Single Father Poverty Comparison
Immigrants from Yemen
Lumbee
20.6%
SINGLE FATHER POVERTY
0.0/ 100
METRIC RATING
326th/ 347
METRIC RANK
28.5%
SINGLE FATHER POVERTY
0.0/ 100
METRIC RATING
343rd/ 347
METRIC RANK
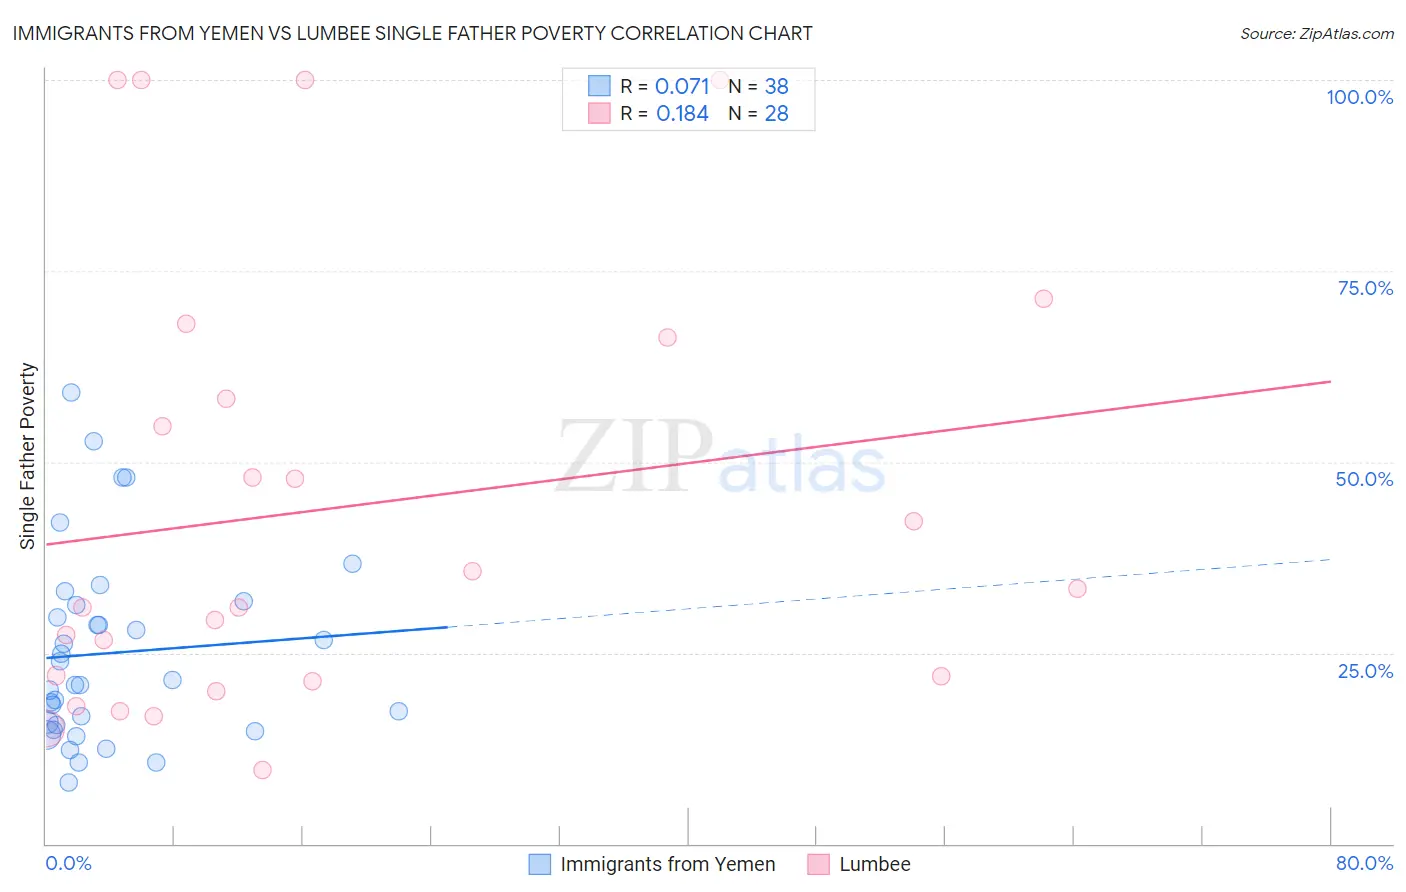
Immigrants from Yemen vs Lumbee Single Father Poverty Correlation Chart
The statistical analysis conducted on geographies consisting of 76,647,654 people shows a slight positive correlation between the proportion of Immigrants from Yemen and poverty level among single fathers in the United States with a correlation coefficient (R) of 0.071 and weighted average of 20.6%. Similarly, the statistical analysis conducted on geographies consisting of 83,517,726 people shows a poor positive correlation between the proportion of Lumbee and poverty level among single fathers in the United States with a correlation coefficient (R) of 0.184 and weighted average of 28.5%, a difference of 38.4%.
Single Father Poverty Correlation Summary
| Measurement | Immigrants from Yemen | Lumbee |
| Minimum | 8.1% | 9.7% |
| Maximum | 59.1% | 100.0% |
| Range | 51.0% | 90.3% |
| Mean | 25.0% | 44.0% |
| Median | 21.1% | 32.1% |
| Interquartile 25% (IQ1) | 15.5% | 21.6% |
| Interquartile 75% (IQ3) | 31.3% | 62.2% |
| Interquartile Range (IQR) | 15.9% | 40.6% |
| Standard Deviation (Sample) | 12.4% | 28.7% |
| Standard Deviation (Population) | 12.2% | 28.2% |
Demographics Similar to Immigrants from Yemen and Lumbee by Single Father Poverty
In terms of single father poverty, the demographic groups most similar to Immigrants from Yemen are Choctaw (20.7%, a difference of 0.69%), Black/African American (20.4%, a difference of 1.0%), American (20.1%, a difference of 2.6%), Pueblo (21.1%, a difference of 2.6%), and Colville (21.4%, a difference of 3.8%). Similarly, the demographic groups most similar to Lumbee are Yuman (28.4%, a difference of 0.33%), Navajo (29.2%, a difference of 2.6%), Hopi (27.2%, a difference of 4.9%), Houma (26.7%, a difference of 6.5%), and Apache (24.2%, a difference of 17.5%).
| Demographics | Rating | Rank | Single Father Poverty |
| Americans | 0.0 /100 | #324 | Tragic 20.1% |
| Blacks/African Americans | 0.0 /100 | #325 | Tragic 20.4% |
| Immigrants | Yemen | 0.0 /100 | #326 | Tragic 20.6% |
| Choctaw | 0.0 /100 | #327 | Tragic 20.7% |
| Pueblo | 0.0 /100 | #328 | Tragic 21.1% |
| Colville | 0.0 /100 | #329 | Tragic 21.4% |
| Paiute | 0.0 /100 | #330 | Tragic 21.6% |
| Central American Indians | 0.0 /100 | #331 | Tragic 21.7% |
| Tohono O'odham | 0.0 /100 | #332 | Tragic 22.0% |
| Natives/Alaskans | 0.0 /100 | #333 | Tragic 22.4% |
| Kiowa | 0.0 /100 | #334 | Tragic 22.5% |
| Shoshone | 0.0 /100 | #335 | Tragic 22.9% |
| Cajuns | 0.0 /100 | #336 | Tragic 23.1% |
| Sioux | 0.0 /100 | #337 | Tragic 23.9% |
| Arapaho | 0.0 /100 | #338 | Tragic 24.0% |
| Apache | 0.0 /100 | #339 | Tragic 24.2% |
| Houma | 0.0 /100 | #340 | Tragic 26.7% |
| Hopi | 0.0 /100 | #341 | Tragic 27.2% |
| Yuman | 0.0 /100 | #342 | Tragic 28.4% |
| Lumbee | 0.0 /100 | #343 | Tragic 28.5% |
| Navajo | 0.0 /100 | #344 | Tragic 29.2% |