Immigrants from Yemen vs Malaysian Single Father Poverty
COMPARE
Immigrants from Yemen
Malaysian
Single Father Poverty
Single Father Poverty Comparison
Immigrants from Yemen
Malaysians
20.6%
SINGLE FATHER POVERTY
0.0/ 100
METRIC RATING
326th/ 347
METRIC RANK
14.9%
SINGLE FATHER POVERTY
99.9/ 100
METRIC RATING
48th/ 347
METRIC RANK
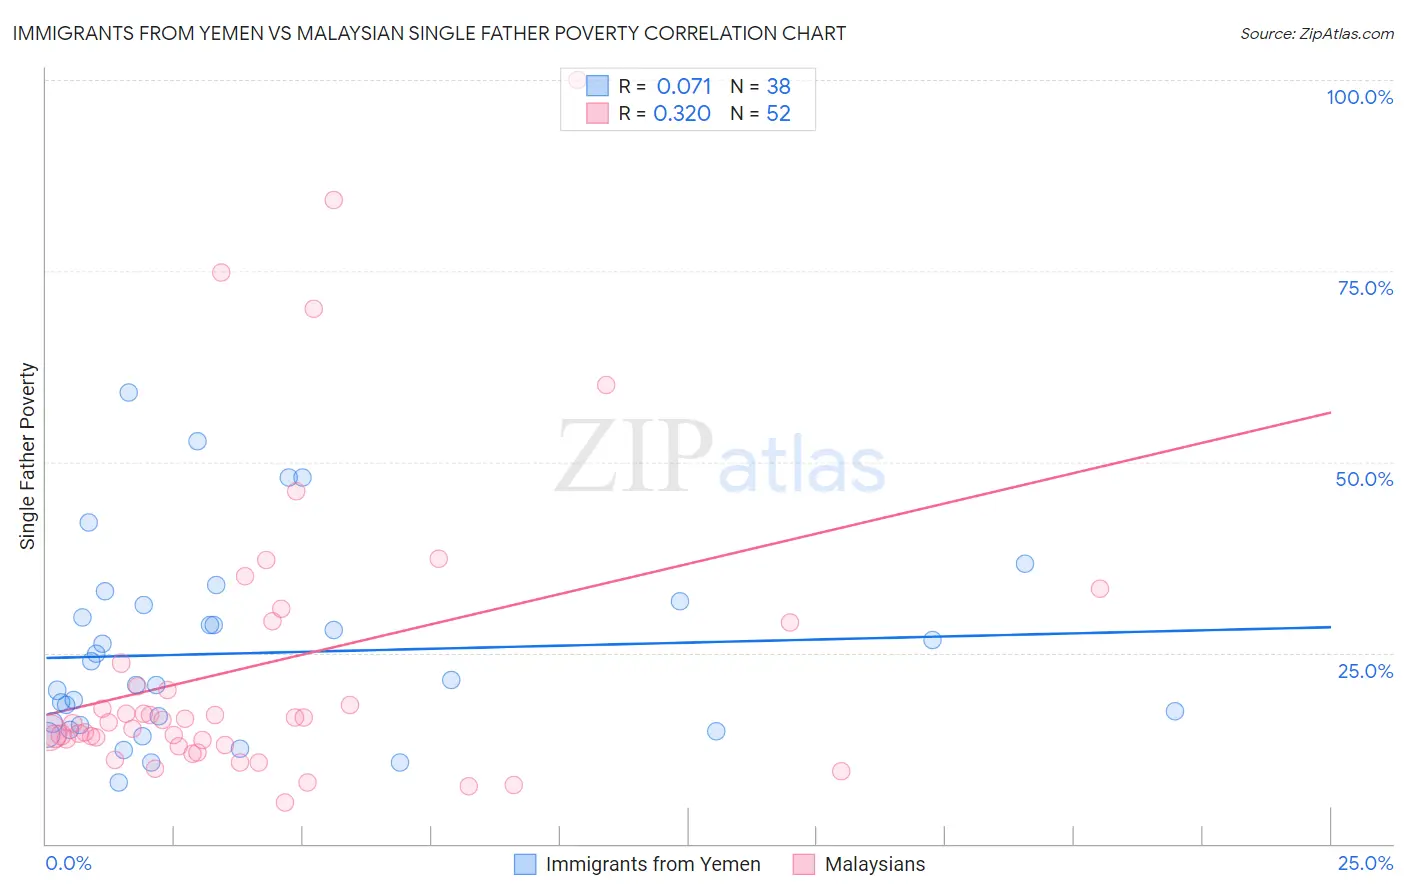
Immigrants from Yemen vs Malaysian Single Father Poverty Correlation Chart
The statistical analysis conducted on geographies consisting of 76,647,654 people shows a slight positive correlation between the proportion of Immigrants from Yemen and poverty level among single fathers in the United States with a correlation coefficient (R) of 0.071 and weighted average of 20.6%. Similarly, the statistical analysis conducted on geographies consisting of 195,666,427 people shows a mild positive correlation between the proportion of Malaysians and poverty level among single fathers in the United States with a correlation coefficient (R) of 0.320 and weighted average of 14.9%, a difference of 37.8%.
Single Father Poverty Correlation Summary
| Measurement | Immigrants from Yemen | Malaysian |
| Minimum | 8.1% | 5.5% |
| Maximum | 59.1% | 100.0% |
| Range | 51.0% | 94.5% |
| Mean | 25.0% | 23.4% |
| Median | 21.1% | 16.1% |
| Interquartile 25% (IQ1) | 15.5% | 13.2% |
| Interquartile 75% (IQ3) | 31.3% | 26.3% |
| Interquartile Range (IQR) | 15.9% | 13.1% |
| Standard Deviation (Sample) | 12.4% | 20.2% |
| Standard Deviation (Population) | 12.2% | 20.0% |
Similar Demographics by Single Father Poverty
Demographics Similar to Immigrants from Yemen by Single Father Poverty
In terms of single father poverty, the demographic groups most similar to Immigrants from Yemen are Choctaw (20.7%, a difference of 0.69%), Black/African American (20.4%, a difference of 1.0%), American (20.1%, a difference of 2.6%), Pueblo (21.1%, a difference of 2.6%), and Pennsylvania German (20.0%, a difference of 2.8%).
| Demographics | Rating | Rank | Single Father Poverty |
| Slovaks | 0.0 /100 | #319 | Tragic 19.3% |
| Inupiat | 0.0 /100 | #320 | Tragic 19.5% |
| Cherokee | 0.0 /100 | #321 | Tragic 19.6% |
| Creek | 0.0 /100 | #322 | Tragic 19.8% |
| Pennsylvania Germans | 0.0 /100 | #323 | Tragic 20.0% |
| Americans | 0.0 /100 | #324 | Tragic 20.1% |
| Blacks/African Americans | 0.0 /100 | #325 | Tragic 20.4% |
| Immigrants | Yemen | 0.0 /100 | #326 | Tragic 20.6% |
| Choctaw | 0.0 /100 | #327 | Tragic 20.7% |
| Pueblo | 0.0 /100 | #328 | Tragic 21.1% |
| Colville | 0.0 /100 | #329 | Tragic 21.4% |
| Paiute | 0.0 /100 | #330 | Tragic 21.6% |
| Central American Indians | 0.0 /100 | #331 | Tragic 21.7% |
| Tohono O'odham | 0.0 /100 | #332 | Tragic 22.0% |
| Natives/Alaskans | 0.0 /100 | #333 | Tragic 22.4% |
Demographics Similar to Malaysians by Single Father Poverty
In terms of single father poverty, the demographic groups most similar to Malaysians are Immigrants from China (14.9%, a difference of 0.010%), Immigrants from Cambodia (14.9%, a difference of 0.030%), Immigrants from Somalia (14.9%, a difference of 0.16%), Immigrants from Eastern Asia (15.0%, a difference of 0.16%), and Bhutanese (15.0%, a difference of 0.21%).
| Demographics | Rating | Rank | Single Father Poverty |
| Indians (Asian) | 100.0 /100 | #41 | Exceptional 14.8% |
| Immigrants | Nepal | 100.0 /100 | #42 | Exceptional 14.8% |
| Immigrants | Eritrea | 100.0 /100 | #43 | Exceptional 14.8% |
| Salvadorans | 100.0 /100 | #44 | Exceptional 14.9% |
| Immigrants | Somalia | 100.0 /100 | #45 | Exceptional 14.9% |
| Immigrants | Cambodia | 99.9 /100 | #46 | Exceptional 14.9% |
| Immigrants | China | 99.9 /100 | #47 | Exceptional 14.9% |
| Malaysians | 99.9 /100 | #48 | Exceptional 14.9% |
| Immigrants | Eastern Asia | 99.9 /100 | #49 | Exceptional 15.0% |
| Bhutanese | 99.9 /100 | #50 | Exceptional 15.0% |
| Immigrants | Pakistan | 99.9 /100 | #51 | Exceptional 15.0% |
| Immigrants | El Salvador | 99.9 /100 | #52 | Exceptional 15.0% |
| Immigrants | Kenya | 99.9 /100 | #53 | Exceptional 15.0% |
| Immigrants | Uzbekistan | 99.9 /100 | #54 | Exceptional 15.0% |
| Immigrants | Bulgaria | 99.9 /100 | #55 | Exceptional 15.0% |