Immigrants from Yemen vs Spanish American Single Father Poverty
COMPARE
Immigrants from Yemen
Spanish American
Single Father Poverty
Single Father Poverty Comparison
Immigrants from Yemen
Spanish Americans
20.6%
SINGLE FATHER POVERTY
0.0/ 100
METRIC RATING
326th/ 347
METRIC RANK
16.9%
SINGLE FATHER POVERTY
3.7/ 100
METRIC RATING
231st/ 347
METRIC RANK
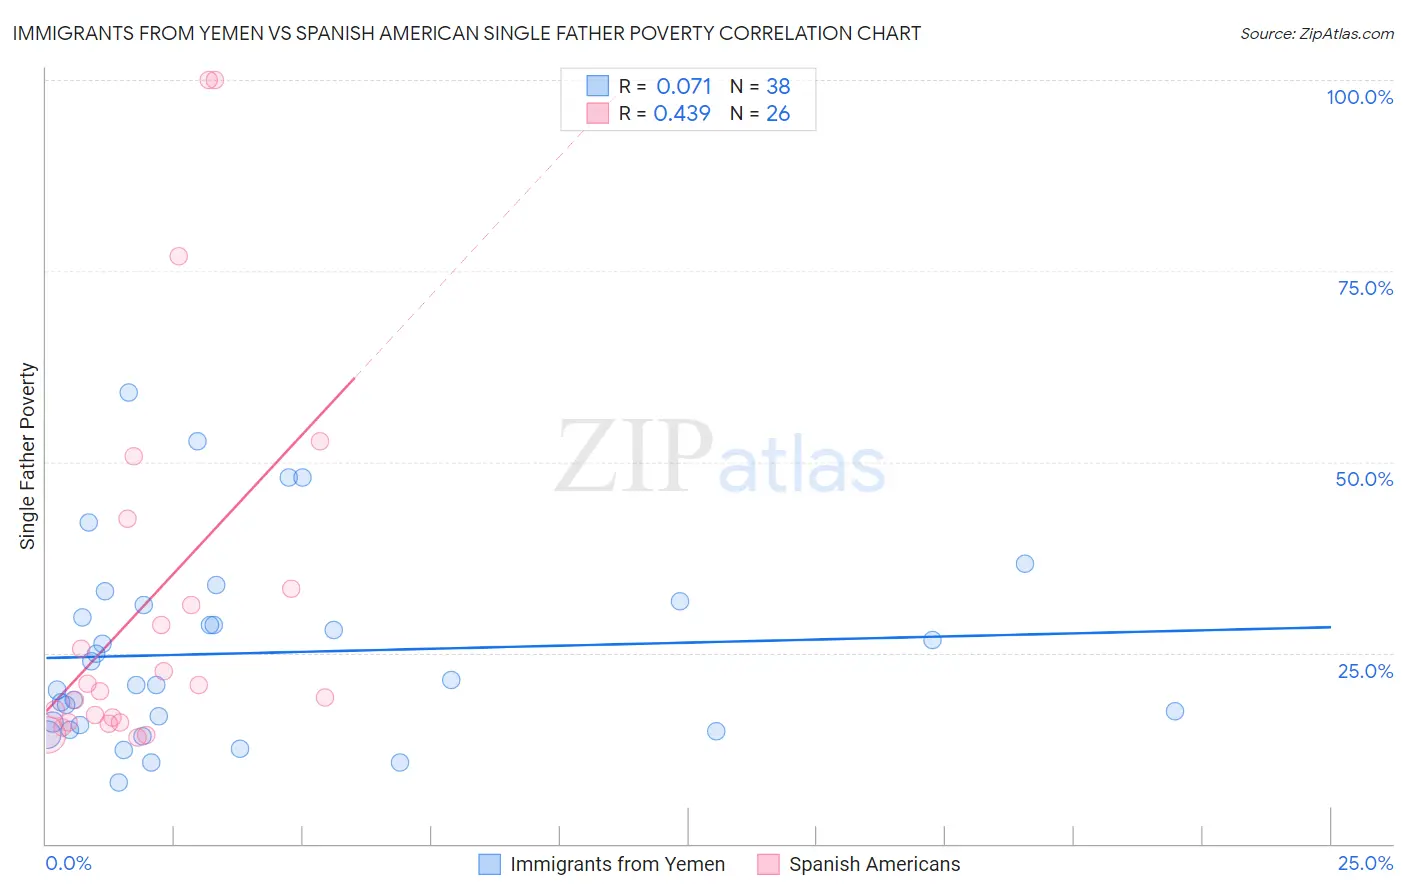
Immigrants from Yemen vs Spanish American Single Father Poverty Correlation Chart
The statistical analysis conducted on geographies consisting of 76,647,654 people shows a slight positive correlation between the proportion of Immigrants from Yemen and poverty level among single fathers in the United States with a correlation coefficient (R) of 0.071 and weighted average of 20.6%. Similarly, the statistical analysis conducted on geographies consisting of 95,172,668 people shows a moderate positive correlation between the proportion of Spanish Americans and poverty level among single fathers in the United States with a correlation coefficient (R) of 0.439 and weighted average of 16.9%, a difference of 21.9%.
Single Father Poverty Correlation Summary
| Measurement | Immigrants from Yemen | Spanish American |
| Minimum | 8.1% | 13.9% |
| Maximum | 59.1% | 100.0% |
| Range | 51.0% | 86.1% |
| Mean | 25.0% | 31.5% |
| Median | 21.1% | 20.4% |
| Interquartile 25% (IQ1) | 15.5% | 15.9% |
| Interquartile 75% (IQ3) | 31.3% | 33.3% |
| Interquartile Range (IQR) | 15.9% | 17.4% |
| Standard Deviation (Sample) | 12.4% | 25.1% |
| Standard Deviation (Population) | 12.2% | 24.6% |
Similar Demographics by Single Father Poverty
Demographics Similar to Immigrants from Yemen by Single Father Poverty
In terms of single father poverty, the demographic groups most similar to Immigrants from Yemen are Choctaw (20.7%, a difference of 0.69%), Black/African American (20.4%, a difference of 1.0%), American (20.1%, a difference of 2.6%), Pueblo (21.1%, a difference of 2.6%), and Pennsylvania German (20.0%, a difference of 2.8%).
| Demographics | Rating | Rank | Single Father Poverty |
| Slovaks | 0.0 /100 | #319 | Tragic 19.3% |
| Inupiat | 0.0 /100 | #320 | Tragic 19.5% |
| Cherokee | 0.0 /100 | #321 | Tragic 19.6% |
| Creek | 0.0 /100 | #322 | Tragic 19.8% |
| Pennsylvania Germans | 0.0 /100 | #323 | Tragic 20.0% |
| Americans | 0.0 /100 | #324 | Tragic 20.1% |
| Blacks/African Americans | 0.0 /100 | #325 | Tragic 20.4% |
| Immigrants | Yemen | 0.0 /100 | #326 | Tragic 20.6% |
| Choctaw | 0.0 /100 | #327 | Tragic 20.7% |
| Pueblo | 0.0 /100 | #328 | Tragic 21.1% |
| Colville | 0.0 /100 | #329 | Tragic 21.4% |
| Paiute | 0.0 /100 | #330 | Tragic 21.6% |
| Central American Indians | 0.0 /100 | #331 | Tragic 21.7% |
| Tohono O'odham | 0.0 /100 | #332 | Tragic 22.0% |
| Natives/Alaskans | 0.0 /100 | #333 | Tragic 22.4% |
Demographics Similar to Spanish Americans by Single Father Poverty
In terms of single father poverty, the demographic groups most similar to Spanish Americans are Immigrants from Grenada (16.9%, a difference of 0.020%), Senegalese (16.9%, a difference of 0.16%), Marshallese (16.9%, a difference of 0.19%), Immigrants from Trinidad and Tobago (16.8%, a difference of 0.21%), and Israeli (16.8%, a difference of 0.24%).
| Demographics | Rating | Rank | Single Father Poverty |
| Immigrants | Norway | 6.5 /100 | #224 | Tragic 16.8% |
| Menominee | 6.4 /100 | #225 | Tragic 16.8% |
| Hispanics or Latinos | 6.1 /100 | #226 | Tragic 16.8% |
| British | 5.6 /100 | #227 | Tragic 16.8% |
| Belgians | 5.3 /100 | #228 | Tragic 16.8% |
| Israelis | 4.6 /100 | #229 | Tragic 16.8% |
| Immigrants | Trinidad and Tobago | 4.5 /100 | #230 | Tragic 16.8% |
| Spanish Americans | 3.7 /100 | #231 | Tragic 16.9% |
| Immigrants | Grenada | 3.7 /100 | #232 | Tragic 16.9% |
| Senegalese | 3.2 /100 | #233 | Tragic 16.9% |
| Marshallese | 3.1 /100 | #234 | Tragic 16.9% |
| Immigrants | Western Europe | 2.9 /100 | #235 | Tragic 16.9% |
| Immigrants | Germany | 2.9 /100 | #236 | Tragic 16.9% |
| Sub-Saharan Africans | 2.9 /100 | #237 | Tragic 16.9% |
| Immigrants | Saudi Arabia | 2.7 /100 | #238 | Tragic 16.9% |