Immigrants from Western Asia vs Scotch-Irish Family Poverty
COMPARE
Immigrants from Western Asia
Scotch-Irish
Family Poverty
Family Poverty Comparison
Immigrants from Western Asia
Scotch-Irish
9.3%
FAMILY POVERTY
28.2/ 100
METRIC RATING
193rd/ 347
METRIC RANK
8.6%
FAMILY POVERTY
82.2/ 100
METRIC RATING
148th/ 347
METRIC RANK
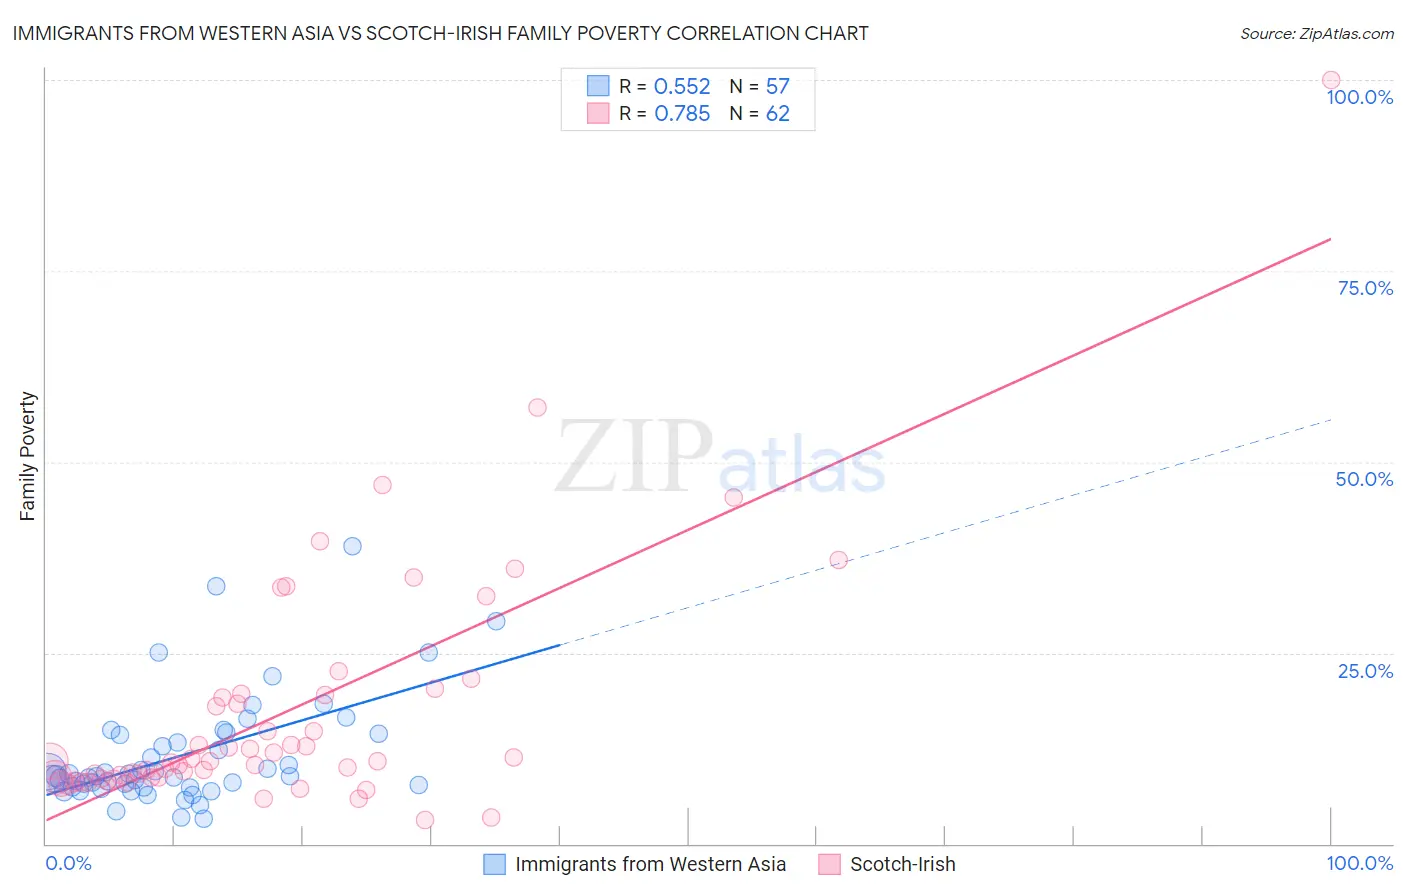
Immigrants from Western Asia vs Scotch-Irish Family Poverty Correlation Chart
The statistical analysis conducted on geographies consisting of 403,212,379 people shows a substantial positive correlation between the proportion of Immigrants from Western Asia and poverty level among families in the United States with a correlation coefficient (R) of 0.552 and weighted average of 9.3%. Similarly, the statistical analysis conducted on geographies consisting of 545,166,810 people shows a strong positive correlation between the proportion of Scotch-Irish and poverty level among families in the United States with a correlation coefficient (R) of 0.785 and weighted average of 8.6%, a difference of 8.5%.
Family Poverty Correlation Summary
| Measurement | Immigrants from Western Asia | Scotch-Irish |
| Minimum | 3.3% | 3.0% |
| Maximum | 38.9% | 100.0% |
| Range | 35.6% | 97.0% |
| Mean | 11.6% | 17.2% |
| Median | 8.9% | 10.8% |
| Interquartile 25% (IQ1) | 7.5% | 8.6% |
| Interquartile 75% (IQ3) | 14.3% | 19.4% |
| Interquartile Range (IQR) | 6.9% | 10.8% |
| Standard Deviation (Sample) | 7.2% | 15.9% |
| Standard Deviation (Population) | 7.1% | 15.7% |
Similar Demographics by Family Poverty
Demographics Similar to Immigrants from Western Asia by Family Poverty
In terms of family poverty, the demographic groups most similar to Immigrants from Western Asia are South American (9.3%, a difference of 0.020%), Spanish (9.3%, a difference of 0.070%), Ugandan (9.3%, a difference of 0.080%), Venezuelan (9.3%, a difference of 0.13%), and Immigrants from Venezuela (9.3%, a difference of 0.34%).
| Demographics | Rating | Rank | Family Poverty |
| Colombians | 36.1 /100 | #186 | Fair 9.2% |
| Delaware | 35.4 /100 | #187 | Fair 9.2% |
| Immigrants | Kenya | 34.0 /100 | #188 | Fair 9.2% |
| Immigrants | Afghanistan | 32.1 /100 | #189 | Fair 9.2% |
| Arabs | 31.5 /100 | #190 | Fair 9.2% |
| Ugandans | 28.7 /100 | #191 | Fair 9.3% |
| Spanish | 28.7 /100 | #192 | Fair 9.3% |
| Immigrants | Western Asia | 28.2 /100 | #193 | Fair 9.3% |
| South Americans | 28.1 /100 | #194 | Fair 9.3% |
| Venezuelans | 27.4 /100 | #195 | Fair 9.3% |
| Immigrants | Venezuela | 26.1 /100 | #196 | Fair 9.3% |
| Immigrants | Colombia | 24.4 /100 | #197 | Fair 9.3% |
| Iraqis | 24.2 /100 | #198 | Fair 9.3% |
| Spaniards | 22.8 /100 | #199 | Fair 9.4% |
| Immigrants | Costa Rica | 21.7 /100 | #200 | Fair 9.4% |
Demographics Similar to Scotch-Irish by Family Poverty
In terms of family poverty, the demographic groups most similar to Scotch-Irish are Immigrants from Jordan (8.5%, a difference of 0.21%), Immigrants from Belarus (8.5%, a difference of 0.24%), Immigrants from South Eastern Asia (8.5%, a difference of 0.25%), Albanian (8.5%, a difference of 0.27%), and Immigrants from Germany (8.5%, a difference of 0.29%).
| Demographics | Rating | Rank | Family Poverty |
| Immigrants | Ukraine | 83.9 /100 | #141 | Excellent 8.5% |
| Yugoslavians | 83.5 /100 | #142 | Excellent 8.5% |
| Immigrants | Germany | 83.3 /100 | #143 | Excellent 8.5% |
| Albanians | 83.3 /100 | #144 | Excellent 8.5% |
| Immigrants | South Eastern Asia | 83.2 /100 | #145 | Excellent 8.5% |
| Immigrants | Belarus | 83.2 /100 | #146 | Excellent 8.5% |
| Immigrants | Jordan | 83.0 /100 | #147 | Excellent 8.5% |
| Scotch-Irish | 82.2 /100 | #148 | Excellent 8.6% |
| Mongolians | 80.4 /100 | #149 | Excellent 8.6% |
| Syrians | 80.3 /100 | #150 | Excellent 8.6% |
| Brazilians | 80.1 /100 | #151 | Excellent 8.6% |
| Samoans | 79.8 /100 | #152 | Good 8.6% |
| Immigrants | Spain | 79.1 /100 | #153 | Good 8.6% |
| Immigrants | Vietnam | 75.4 /100 | #154 | Good 8.7% |
| Immigrants | Kuwait | 73.6 /100 | #155 | Good 8.7% |