Argentinean vs Scotch-Irish Family Poverty
COMPARE
Argentinean
Scotch-Irish
Family Poverty
Family Poverty Comparison
Argentineans
Scotch-Irish
8.4%
FAMILY POVERTY
89.6/ 100
METRIC RATING
128th/ 347
METRIC RANK
8.6%
FAMILY POVERTY
82.2/ 100
METRIC RATING
148th/ 347
METRIC RANK
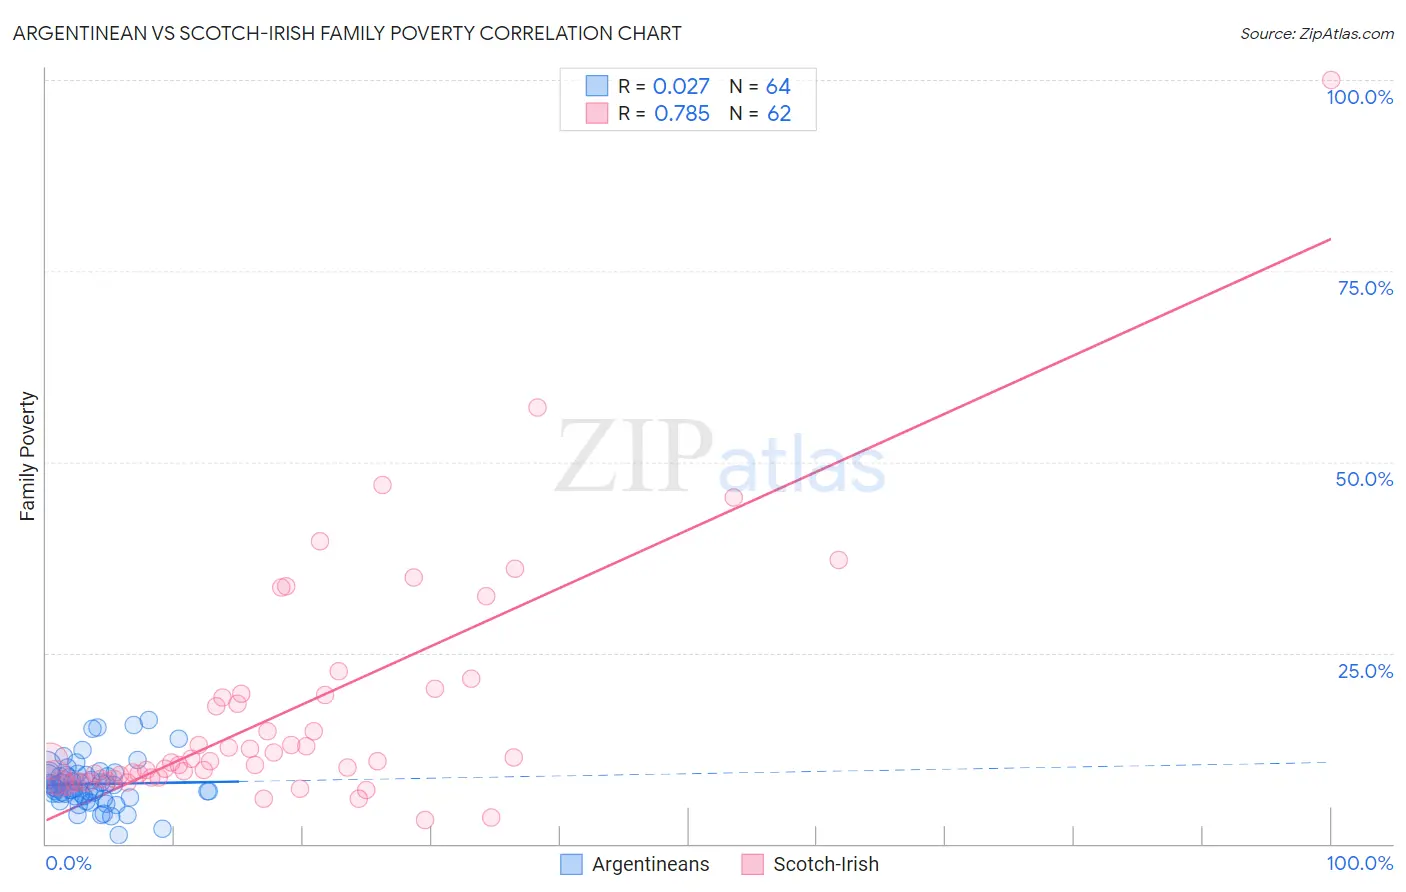
Argentinean vs Scotch-Irish Family Poverty Correlation Chart
The statistical analysis conducted on geographies consisting of 296,579,714 people shows no correlation between the proportion of Argentineans and poverty level among families in the United States with a correlation coefficient (R) of 0.027 and weighted average of 8.4%. Similarly, the statistical analysis conducted on geographies consisting of 545,166,810 people shows a strong positive correlation between the proportion of Scotch-Irish and poverty level among families in the United States with a correlation coefficient (R) of 0.785 and weighted average of 8.6%, a difference of 2.2%.
Family Poverty Correlation Summary
| Measurement | Argentinean | Scotch-Irish |
| Minimum | 1.2% | 3.0% |
| Maximum | 16.2% | 100.0% |
| Range | 14.9% | 97.0% |
| Mean | 7.8% | 17.2% |
| Median | 7.4% | 10.8% |
| Interquartile 25% (IQ1) | 6.2% | 8.6% |
| Interquartile 75% (IQ3) | 9.0% | 19.4% |
| Interquartile Range (IQR) | 2.9% | 10.8% |
| Standard Deviation (Sample) | 3.0% | 15.9% |
| Standard Deviation (Population) | 3.0% | 15.7% |
Demographics Similar to Argentineans and Scotch-Irish by Family Poverty
In terms of family poverty, the demographic groups most similar to Argentineans are Portuguese (8.4%, a difference of 0.15%), Immigrants from Bosnia and Herzegovina (8.4%, a difference of 0.34%), Puget Sound Salish (8.4%, a difference of 0.35%), Immigrants from Argentina (8.4%, a difference of 0.49%), and Sri Lankan (8.5%, a difference of 1.0%). Similarly, the demographic groups most similar to Scotch-Irish are Immigrants from Jordan (8.5%, a difference of 0.21%), Immigrants from Belarus (8.5%, a difference of 0.24%), Immigrants from South Eastern Asia (8.5%, a difference of 0.25%), Albanian (8.5%, a difference of 0.27%), and Immigrants from Germany (8.5%, a difference of 0.29%).
| Demographics | Rating | Rank | Family Poverty |
| Argentineans | 89.6 /100 | #128 | Excellent 8.4% |
| Portuguese | 89.2 /100 | #129 | Excellent 8.4% |
| Immigrants | Bosnia and Herzegovina | 88.6 /100 | #130 | Excellent 8.4% |
| Puget Sound Salish | 88.6 /100 | #131 | Excellent 8.4% |
| Immigrants | Argentina | 88.2 /100 | #132 | Excellent 8.4% |
| Sri Lankans | 86.6 /100 | #133 | Excellent 8.5% |
| Chileans | 86.6 /100 | #134 | Excellent 8.5% |
| Immigrants | Malaysia | 86.5 /100 | #135 | Excellent 8.5% |
| Immigrants | Brazil | 86.3 /100 | #136 | Excellent 8.5% |
| Immigrants | Southern Europe | 86.0 /100 | #137 | Excellent 8.5% |
| Armenians | 84.6 /100 | #138 | Excellent 8.5% |
| Immigrants | Nepal | 84.2 /100 | #139 | Excellent 8.5% |
| Immigrants | Kazakhstan | 84.1 /100 | #140 | Excellent 8.5% |
| Immigrants | Ukraine | 83.9 /100 | #141 | Excellent 8.5% |
| Yugoslavians | 83.5 /100 | #142 | Excellent 8.5% |
| Immigrants | Germany | 83.3 /100 | #143 | Excellent 8.5% |
| Albanians | 83.3 /100 | #144 | Excellent 8.5% |
| Immigrants | South Eastern Asia | 83.2 /100 | #145 | Excellent 8.5% |
| Immigrants | Belarus | 83.2 /100 | #146 | Excellent 8.5% |
| Immigrants | Jordan | 83.0 /100 | #147 | Excellent 8.5% |
| Scotch-Irish | 82.2 /100 | #148 | Excellent 8.6% |