Ukrainian vs Scotch-Irish Family Poverty
COMPARE
Ukrainian
Scotch-Irish
Family Poverty
Family Poverty Comparison
Ukrainians
Scotch-Irish
7.9%
FAMILY POVERTY
98.0/ 100
METRIC RATING
77th/ 347
METRIC RANK
8.6%
FAMILY POVERTY
82.2/ 100
METRIC RATING
148th/ 347
METRIC RANK
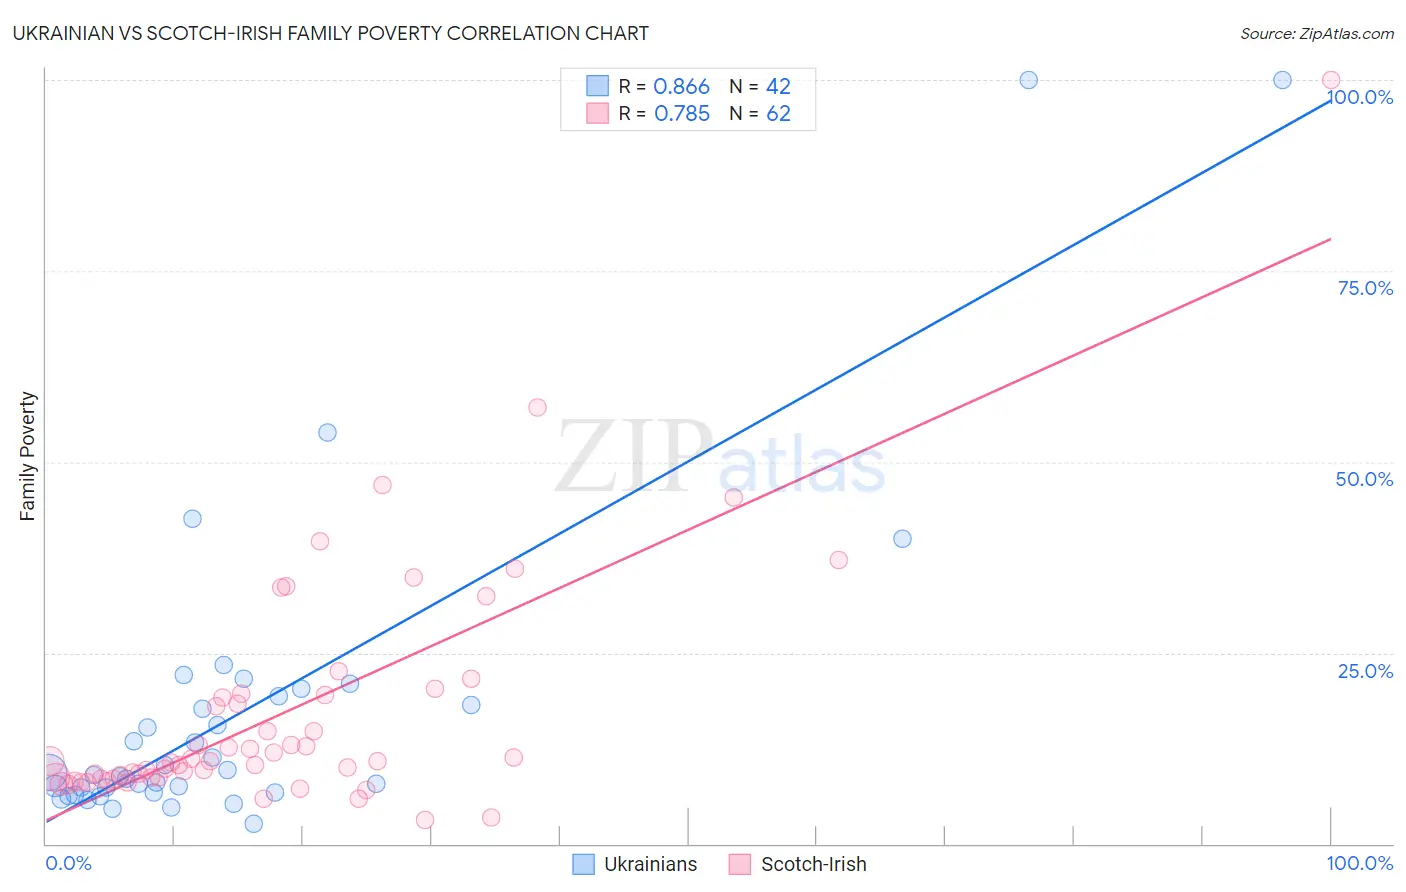
Ukrainian vs Scotch-Irish Family Poverty Correlation Chart
The statistical analysis conducted on geographies consisting of 446,514,525 people shows a very strong positive correlation between the proportion of Ukrainians and poverty level among families in the United States with a correlation coefficient (R) of 0.866 and weighted average of 7.9%. Similarly, the statistical analysis conducted on geographies consisting of 545,166,810 people shows a strong positive correlation between the proportion of Scotch-Irish and poverty level among families in the United States with a correlation coefficient (R) of 0.785 and weighted average of 8.6%, a difference of 8.8%.
Family Poverty Correlation Summary
| Measurement | Ukrainian | Scotch-Irish |
| Minimum | 2.6% | 3.0% |
| Maximum | 100.0% | 100.0% |
| Range | 97.4% | 97.0% |
| Mean | 17.6% | 17.2% |
| Median | 9.2% | 10.8% |
| Interquartile 25% (IQ1) | 6.8% | 8.6% |
| Interquartile 75% (IQ3) | 19.3% | 19.4% |
| Interquartile Range (IQR) | 12.5% | 10.8% |
| Standard Deviation (Sample) | 21.5% | 15.9% |
| Standard Deviation (Population) | 21.2% | 15.7% |
Similar Demographics by Family Poverty
Demographics Similar to Ukrainians by Family Poverty
In terms of family poverty, the demographic groups most similar to Ukrainians are Immigrants from Latvia (7.9%, a difference of 0.010%), Immigrants from North America (7.9%, a difference of 0.12%), Immigrants from Europe (7.9%, a difference of 0.19%), Immigrants from Croatia (7.8%, a difference of 0.24%), and English (7.9%, a difference of 0.25%).
| Demographics | Rating | Rank | Family Poverty |
| Immigrants | Canada | 98.2 /100 | #70 | Exceptional 7.8% |
| Cambodians | 98.2 /100 | #71 | Exceptional 7.8% |
| Immigrants | Romania | 98.2 /100 | #72 | Exceptional 7.8% |
| Austrians | 98.2 /100 | #73 | Exceptional 7.8% |
| Immigrants | China | 98.1 /100 | #74 | Exceptional 7.8% |
| Immigrants | Croatia | 98.1 /100 | #75 | Exceptional 7.8% |
| Immigrants | Latvia | 98.0 /100 | #76 | Exceptional 7.9% |
| Ukrainians | 98.0 /100 | #77 | Exceptional 7.9% |
| Immigrants | North America | 97.9 /100 | #78 | Exceptional 7.9% |
| Immigrants | Europe | 97.8 /100 | #79 | Exceptional 7.9% |
| English | 97.8 /100 | #80 | Exceptional 7.9% |
| Irish | 97.8 /100 | #81 | Exceptional 7.9% |
| Immigrants | Poland | 97.8 /100 | #82 | Exceptional 7.9% |
| Slovaks | 97.7 /100 | #83 | Exceptional 7.9% |
| British | 97.5 /100 | #84 | Exceptional 7.9% |
Demographics Similar to Scotch-Irish by Family Poverty
In terms of family poverty, the demographic groups most similar to Scotch-Irish are Immigrants from Jordan (8.5%, a difference of 0.21%), Immigrants from Belarus (8.5%, a difference of 0.24%), Immigrants from South Eastern Asia (8.5%, a difference of 0.25%), Albanian (8.5%, a difference of 0.27%), and Immigrants from Germany (8.5%, a difference of 0.29%).
| Demographics | Rating | Rank | Family Poverty |
| Immigrants | Ukraine | 83.9 /100 | #141 | Excellent 8.5% |
| Yugoslavians | 83.5 /100 | #142 | Excellent 8.5% |
| Immigrants | Germany | 83.3 /100 | #143 | Excellent 8.5% |
| Albanians | 83.3 /100 | #144 | Excellent 8.5% |
| Immigrants | South Eastern Asia | 83.2 /100 | #145 | Excellent 8.5% |
| Immigrants | Belarus | 83.2 /100 | #146 | Excellent 8.5% |
| Immigrants | Jordan | 83.0 /100 | #147 | Excellent 8.5% |
| Scotch-Irish | 82.2 /100 | #148 | Excellent 8.6% |
| Mongolians | 80.4 /100 | #149 | Excellent 8.6% |
| Syrians | 80.3 /100 | #150 | Excellent 8.6% |
| Brazilians | 80.1 /100 | #151 | Excellent 8.6% |
| Samoans | 79.8 /100 | #152 | Good 8.6% |
| Immigrants | Spain | 79.1 /100 | #153 | Good 8.6% |
| Immigrants | Vietnam | 75.4 /100 | #154 | Good 8.7% |
| Immigrants | Kuwait | 73.6 /100 | #155 | Good 8.7% |