Immigrants from Western Asia vs Osage Family Poverty
COMPARE
Immigrants from Western Asia
Osage
Family Poverty
Family Poverty Comparison
Immigrants from Western Asia
Osage
9.3%
FAMILY POVERTY
28.2/ 100
METRIC RATING
193rd/ 347
METRIC RANK
9.7%
FAMILY POVERTY
8.0/ 100
METRIC RATING
213th/ 347
METRIC RANK
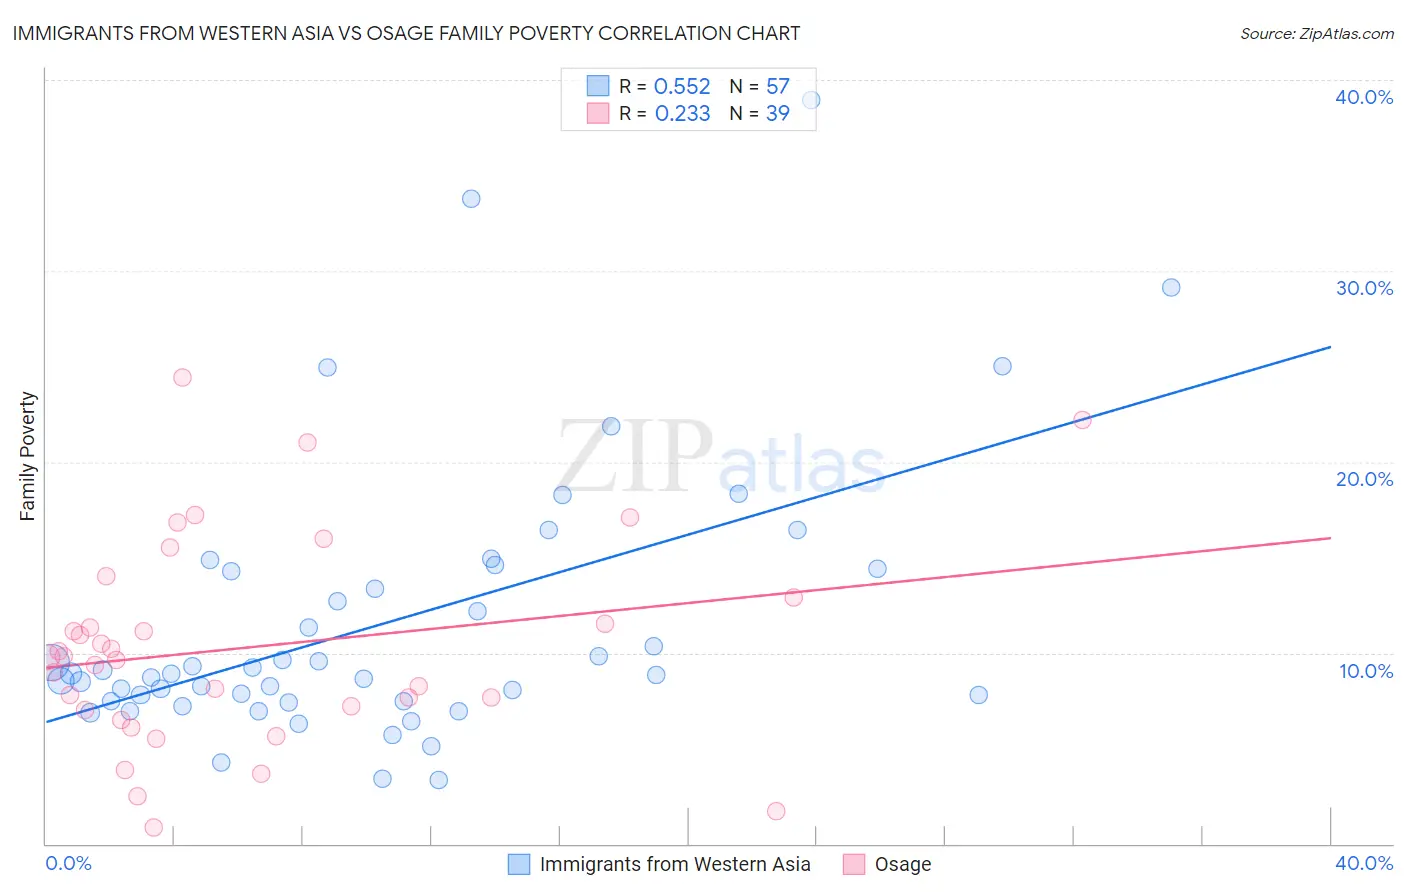
Immigrants from Western Asia vs Osage Family Poverty Correlation Chart
The statistical analysis conducted on geographies consisting of 403,212,379 people shows a substantial positive correlation between the proportion of Immigrants from Western Asia and poverty level among families in the United States with a correlation coefficient (R) of 0.552 and weighted average of 9.3%. Similarly, the statistical analysis conducted on geographies consisting of 91,772,722 people shows a weak positive correlation between the proportion of Osage and poverty level among families in the United States with a correlation coefficient (R) of 0.233 and weighted average of 9.7%, a difference of 4.8%.
Family Poverty Correlation Summary
| Measurement | Immigrants from Western Asia | Osage |
| Minimum | 3.3% | 0.88% |
| Maximum | 38.9% | 24.4% |
| Range | 35.6% | 23.6% |
| Mean | 11.6% | 10.3% |
| Median | 8.9% | 9.8% |
| Interquartile 25% (IQ1) | 7.5% | 7.0% |
| Interquartile 75% (IQ3) | 14.3% | 12.9% |
| Interquartile Range (IQR) | 6.9% | 5.9% |
| Standard Deviation (Sample) | 7.2% | 5.4% |
| Standard Deviation (Population) | 7.1% | 5.4% |
Demographics Similar to Immigrants from Western Asia and Osage by Family Poverty
In terms of family poverty, the demographic groups most similar to Immigrants from Western Asia are South American (9.3%, a difference of 0.020%), Venezuelan (9.3%, a difference of 0.13%), Immigrants from Venezuela (9.3%, a difference of 0.34%), Immigrants from Colombia (9.3%, a difference of 0.63%), and Iraqi (9.3%, a difference of 0.66%). Similarly, the demographic groups most similar to Osage are Immigrants from Thailand (9.7%, a difference of 0.63%), Malaysian (9.6%, a difference of 0.94%), Alsatian (9.6%, a difference of 1.2%), Immigrants from Uruguay (9.5%, a difference of 1.9%), and Immigrants from Eastern Africa (9.5%, a difference of 2.2%).
| Demographics | Rating | Rank | Family Poverty |
| Immigrants | Western Asia | 28.2 /100 | #193 | Fair 9.3% |
| South Americans | 28.1 /100 | #194 | Fair 9.3% |
| Venezuelans | 27.4 /100 | #195 | Fair 9.3% |
| Immigrants | Venezuela | 26.1 /100 | #196 | Fair 9.3% |
| Immigrants | Colombia | 24.4 /100 | #197 | Fair 9.3% |
| Iraqis | 24.2 /100 | #198 | Fair 9.3% |
| Spaniards | 22.8 /100 | #199 | Fair 9.4% |
| Immigrants | Costa Rica | 21.7 /100 | #200 | Fair 9.4% |
| Immigrants | Portugal | 20.5 /100 | #201 | Fair 9.4% |
| Immigrants | Sierra Leone | 19.6 /100 | #202 | Poor 9.4% |
| German Russians | 19.4 /100 | #203 | Poor 9.4% |
| Immigrants | Lebanon | 18.9 /100 | #204 | Poor 9.4% |
| Aleuts | 18.0 /100 | #205 | Poor 9.5% |
| Immigrants | South America | 18.0 /100 | #206 | Poor 9.5% |
| Sierra Leoneans | 15.6 /100 | #207 | Poor 9.5% |
| Immigrants | Eastern Africa | 15.1 /100 | #208 | Poor 9.5% |
| Immigrants | Uruguay | 14.0 /100 | #209 | Poor 9.5% |
| Alsatians | 11.3 /100 | #210 | Poor 9.6% |
| Malaysians | 10.6 /100 | #211 | Poor 9.6% |
| Immigrants | Thailand | 9.7 /100 | #212 | Tragic 9.7% |
| Osage | 8.0 /100 | #213 | Tragic 9.7% |