Immigrants from Western Asia vs Scotch-Irish Child Poverty Among Boys Under 16
COMPARE
Immigrants from Western Asia
Scotch-Irish
Child Poverty Among Boys Under 16
Child Poverty Among Boys Under 16 Comparison
Immigrants from Western Asia
Scotch-Irish
16.6%
CHILD POVERTY AMONG BOYS UNDER 16
40.4/ 100
METRIC RATING
185th/ 347
METRIC RANK
16.5%
CHILD POVERTY AMONG BOYS UNDER 16
47.5/ 100
METRIC RATING
178th/ 347
METRIC RANK
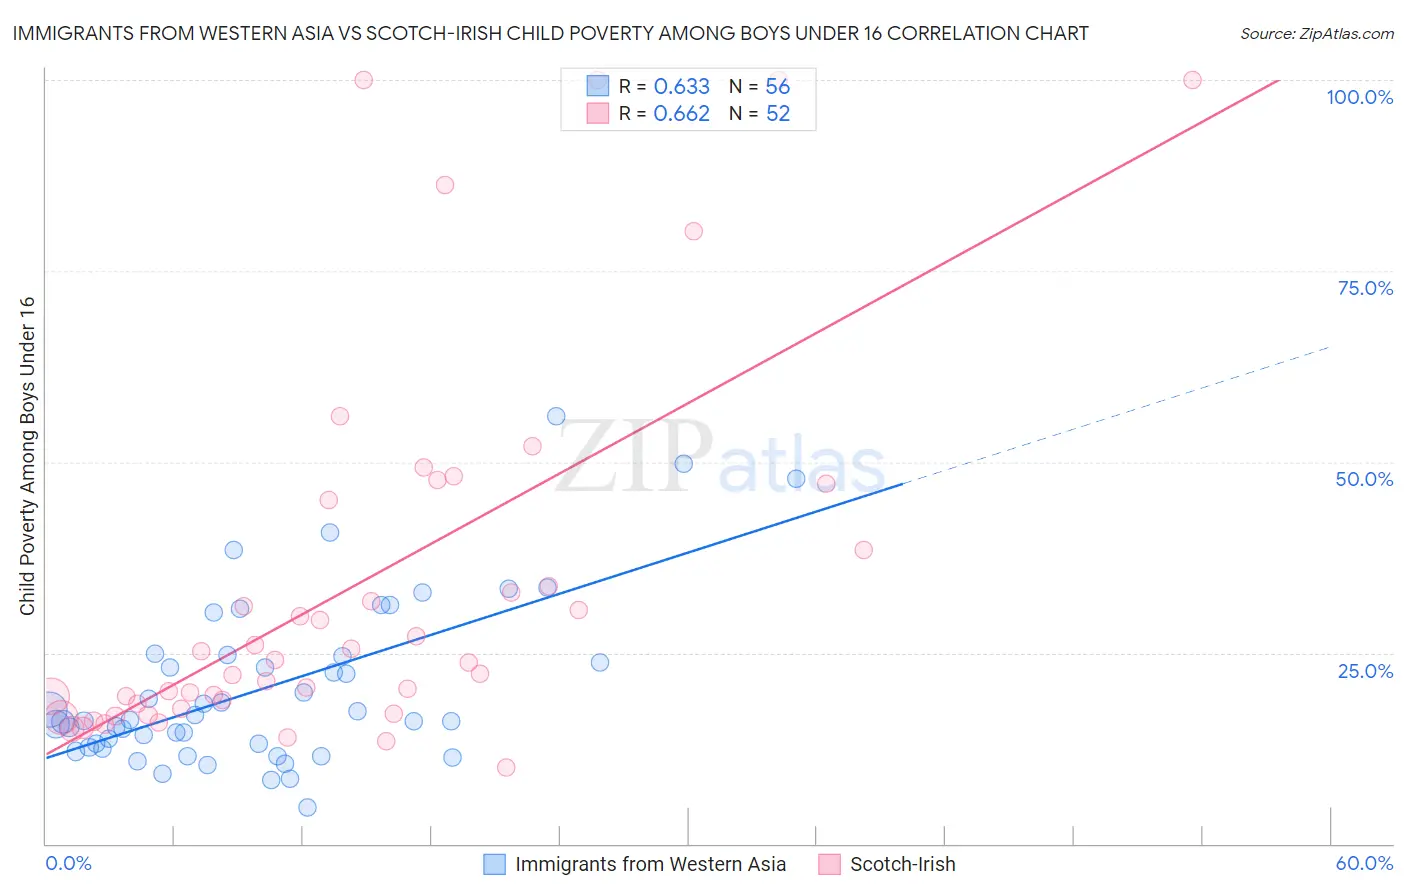
Immigrants from Western Asia vs Scotch-Irish Child Poverty Among Boys Under 16 Correlation Chart
The statistical analysis conducted on geographies consisting of 396,864,941 people shows a significant positive correlation between the proportion of Immigrants from Western Asia and poverty level among boys under the age of 16 in the United States with a correlation coefficient (R) of 0.633 and weighted average of 16.6%. Similarly, the statistical analysis conducted on geographies consisting of 530,822,758 people shows a significant positive correlation between the proportion of Scotch-Irish and poverty level among boys under the age of 16 in the United States with a correlation coefficient (R) of 0.662 and weighted average of 16.5%, a difference of 0.81%.
Child Poverty Among Boys Under 16 Correlation Summary
| Measurement | Immigrants from Western Asia | Scotch-Irish |
| Minimum | 4.7% | 10.0% |
| Maximum | 55.9% | 100.0% |
| Range | 51.2% | 90.0% |
| Mean | 20.4% | 33.9% |
| Median | 16.2% | 23.9% |
| Interquartile 25% (IQ1) | 12.8% | 18.0% |
| Interquartile 75% (IQ3) | 24.7% | 41.8% |
| Interquartile Range (IQR) | 11.9% | 23.8% |
| Standard Deviation (Sample) | 10.9% | 24.8% |
| Standard Deviation (Population) | 10.9% | 24.6% |
Demographics Similar to Immigrants from Western Asia and Scotch-Irish by Child Poverty Among Boys Under 16
In terms of child poverty among boys under 16, the demographic groups most similar to Immigrants from Western Asia are Celtic (16.6%, a difference of 0.030%), Kenyan (16.6%, a difference of 0.070%), Hmong (16.6%, a difference of 0.22%), Immigrants from Costa Rica (16.7%, a difference of 0.30%), and Immigrants from South America (16.7%, a difference of 0.31%). Similarly, the demographic groups most similar to Scotch-Irish are Hungarian (16.5%, a difference of 0.020%), Ethiopian (16.5%, a difference of 0.040%), White/Caucasian (16.5%, a difference of 0.080%), Immigrants from Syria (16.5%, a difference of 0.17%), and Hawaiian (16.5%, a difference of 0.22%).
| Demographics | Rating | Rank | Child Poverty Among Boys Under 16 |
| Immigrants | Ethiopia | 51.3 /100 | #171 | Average 16.4% |
| Immigrants | Colombia | 50.8 /100 | #172 | Average 16.4% |
| Tsimshian | 50.5 /100 | #173 | Average 16.4% |
| Uruguayans | 50.0 /100 | #174 | Average 16.4% |
| Immigrants | Syria | 49.0 /100 | #175 | Average 16.5% |
| Whites/Caucasians | 48.2 /100 | #176 | Average 16.5% |
| Ethiopians | 47.8 /100 | #177 | Average 16.5% |
| Scotch-Irish | 47.5 /100 | #178 | Average 16.5% |
| Hungarians | 47.3 /100 | #179 | Average 16.5% |
| Hawaiians | 45.5 /100 | #180 | Average 16.5% |
| South American Indians | 44.3 /100 | #181 | Average 16.5% |
| Lebanese | 43.3 /100 | #182 | Average 16.6% |
| Kenyans | 41.0 /100 | #183 | Average 16.6% |
| Celtics | 40.6 /100 | #184 | Average 16.6% |
| Immigrants | Western Asia | 40.4 /100 | #185 | Average 16.6% |
| Hmong | 38.4 /100 | #186 | Fair 16.6% |
| Immigrants | Costa Rica | 37.8 /100 | #187 | Fair 16.7% |
| Immigrants | South America | 37.7 /100 | #188 | Fair 16.7% |
| Immigrants | Morocco | 34.5 /100 | #189 | Fair 16.7% |
| Arabs | 31.1 /100 | #190 | Fair 16.8% |
| Alaska Natives | 29.8 /100 | #191 | Fair 16.8% |