Immigrants from Western Asia vs Hmong Single Female Poverty
COMPARE
Immigrants from Western Asia
Hmong
Single Female Poverty
Single Female Poverty Comparison
Immigrants from Western Asia
Hmong
19.9%
SINGLE FEMALE POVERTY
96.5/ 100
METRIC RATING
110th/ 347
METRIC RANK
23.1%
SINGLE FEMALE POVERTY
0.2/ 100
METRIC RATING
269th/ 347
METRIC RANK
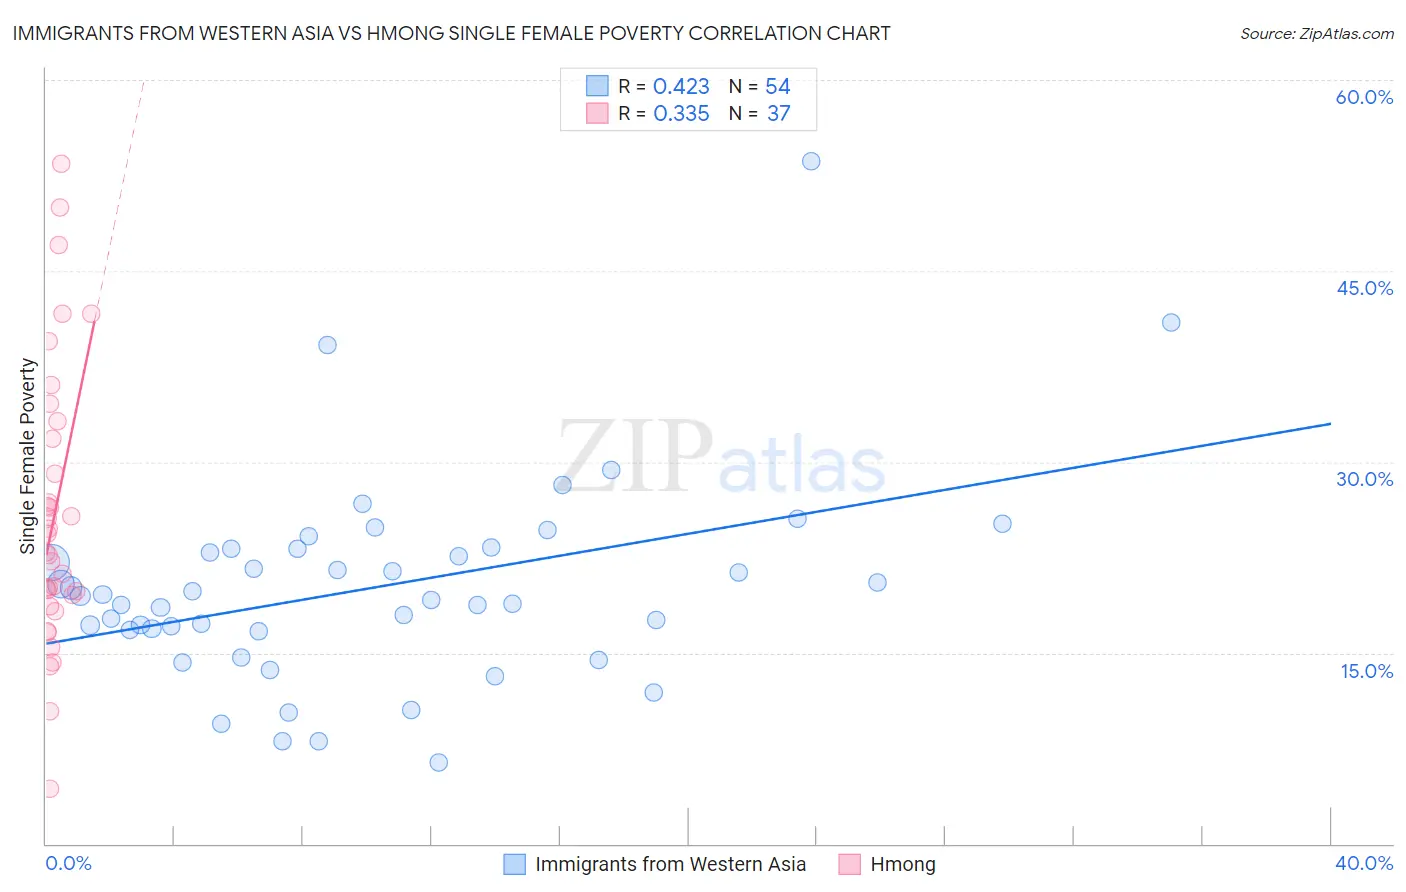
Immigrants from Western Asia vs Hmong Single Female Poverty Correlation Chart
The statistical analysis conducted on geographies consisting of 397,084,795 people shows a moderate positive correlation between the proportion of Immigrants from Western Asia and poverty level among single females in the United States with a correlation coefficient (R) of 0.423 and weighted average of 19.9%. Similarly, the statistical analysis conducted on geographies consisting of 24,642,418 people shows a mild positive correlation between the proportion of Hmong and poverty level among single females in the United States with a correlation coefficient (R) of 0.335 and weighted average of 23.1%, a difference of 15.8%.
Single Female Poverty Correlation Summary
| Measurement | Immigrants from Western Asia | Hmong |
| Minimum | 6.4% | 4.3% |
| Maximum | 53.6% | 53.4% |
| Range | 47.2% | 49.1% |
| Mean | 20.1% | 25.8% |
| Median | 19.3% | 22.9% |
| Interquartile 25% (IQ1) | 16.8% | 19.1% |
| Interquartile 75% (IQ3) | 23.2% | 32.5% |
| Interquartile Range (IQR) | 6.4% | 13.4% |
| Standard Deviation (Sample) | 8.0% | 11.0% |
| Standard Deviation (Population) | 7.9% | 10.9% |
Similar Demographics by Single Female Poverty
Demographics Similar to Immigrants from Western Asia by Single Female Poverty
In terms of single female poverty, the demographic groups most similar to Immigrants from Western Asia are Colombian (19.9%, a difference of 0.010%), Native Hawaiian (19.9%, a difference of 0.020%), Immigrants from Syria (19.9%, a difference of 0.070%), Ethiopian (19.9%, a difference of 0.080%), and Israeli (19.9%, a difference of 0.18%).
| Demographics | Rating | Rank | Single Female Poverty |
| Immigrants | Southern Europe | 97.1 /100 | #103 | Exceptional 19.9% |
| Chileans | 96.9 /100 | #104 | Exceptional 19.9% |
| Israelis | 96.9 /100 | #105 | Exceptional 19.9% |
| Ethiopians | 96.7 /100 | #106 | Exceptional 19.9% |
| Immigrants | Syria | 96.7 /100 | #107 | Exceptional 19.9% |
| Native Hawaiians | 96.6 /100 | #108 | Exceptional 19.9% |
| Colombians | 96.6 /100 | #109 | Exceptional 19.9% |
| Immigrants | Western Asia | 96.5 /100 | #110 | Exceptional 19.9% |
| Carpatho Rusyns | 96.1 /100 | #111 | Exceptional 20.0% |
| Immigrants | Netherlands | 96.0 /100 | #112 | Exceptional 20.0% |
| Immigrants | Zimbabwe | 95.9 /100 | #113 | Exceptional 20.0% |
| Immigrants | Colombia | 95.9 /100 | #114 | Exceptional 20.0% |
| Immigrants | Northern Africa | 95.8 /100 | #115 | Exceptional 20.0% |
| Immigrants | Kazakhstan | 95.7 /100 | #116 | Exceptional 20.0% |
| Poles | 95.6 /100 | #117 | Exceptional 20.0% |
Demographics Similar to Hmong by Single Female Poverty
In terms of single female poverty, the demographic groups most similar to Hmong are Fijian (23.1%, a difference of 0.030%), Senegalese (23.0%, a difference of 0.10%), Immigrants from Micronesia (23.0%, a difference of 0.16%), Inupiat (23.1%, a difference of 0.26%), and Central American (23.0%, a difference of 0.37%).
| Demographics | Rating | Rank | Single Female Poverty |
| British West Indians | 0.4 /100 | #262 | Tragic 22.8% |
| Scotch-Irish | 0.3 /100 | #263 | Tragic 22.9% |
| Immigrants | Laos | 0.3 /100 | #264 | Tragic 22.9% |
| Central Americans | 0.2 /100 | #265 | Tragic 23.0% |
| Immigrants | Micronesia | 0.2 /100 | #266 | Tragic 23.0% |
| Senegalese | 0.2 /100 | #267 | Tragic 23.0% |
| Fijians | 0.2 /100 | #268 | Tragic 23.1% |
| Hmong | 0.2 /100 | #269 | Tragic 23.1% |
| Inupiat | 0.2 /100 | #270 | Tragic 23.1% |
| Sub-Saharan Africans | 0.1 /100 | #271 | Tragic 23.2% |
| Immigrants | Senegal | 0.1 /100 | #272 | Tragic 23.2% |
| Alaska Natives | 0.1 /100 | #273 | Tragic 23.3% |
| Marshallese | 0.1 /100 | #274 | Tragic 23.3% |
| Mexican American Indians | 0.1 /100 | #275 | Tragic 23.4% |
| Immigrants | Azores | 0.0 /100 | #276 | Tragic 23.5% |