Immigrants from West Indies vs Cherokee Doctorate Degree
COMPARE
Immigrants from West Indies
Cherokee
Doctorate Degree
Doctorate Degree Comparison
Immigrants from West Indies
Cherokee
1.5%
DOCTORATE DEGREE
0.9/ 100
METRIC RATING
258th/ 347
METRIC RANK
1.5%
DOCTORATE DEGREE
0.3/ 100
METRIC RATING
286th/ 347
METRIC RANK
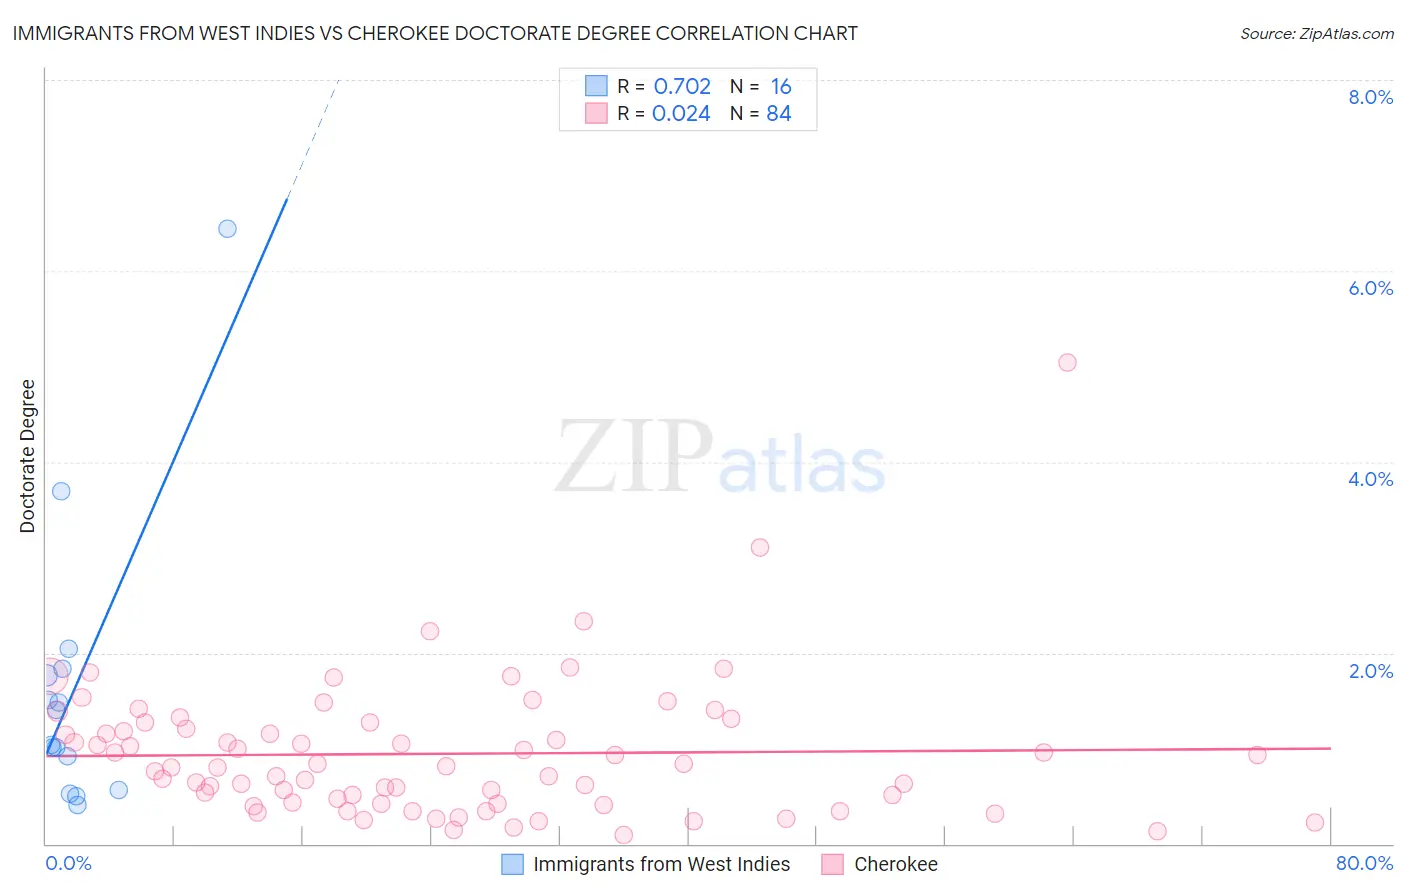
Immigrants from West Indies vs Cherokee Doctorate Degree Correlation Chart
The statistical analysis conducted on geographies consisting of 72,397,749 people shows a strong positive correlation between the proportion of Immigrants from West Indies and percentage of population with at least doctorate degree education in the United States with a correlation coefficient (R) of 0.702 and weighted average of 1.5%. Similarly, the statistical analysis conducted on geographies consisting of 478,818,263 people shows no correlation between the proportion of Cherokee and percentage of population with at least doctorate degree education in the United States with a correlation coefficient (R) of 0.024 and weighted average of 1.5%, a difference of 4.6%.
Doctorate Degree Correlation Summary
| Measurement | Immigrants from West Indies | Cherokee |
| Minimum | 0.40% | 0.091% |
| Maximum | 6.4% | 5.0% |
| Range | 6.0% | 5.0% |
| Mean | 1.6% | 0.94% |
| Median | 1.2% | 0.81% |
| Interquartile 25% (IQ1) | 0.74% | 0.43% |
| Interquartile 75% (IQ3) | 1.8% | 1.2% |
| Interquartile Range (IQR) | 1.1% | 0.81% |
| Standard Deviation (Sample) | 1.5% | 0.73% |
| Standard Deviation (Population) | 1.5% | 0.72% |
Similar Demographics by Doctorate Degree
Demographics Similar to Immigrants from West Indies by Doctorate Degree
In terms of doctorate degree, the demographic groups most similar to Immigrants from West Indies are Liberian (1.5%, a difference of 0.030%), Japanese (1.5%, a difference of 0.12%), Chippewa (1.5%, a difference of 0.26%), Central American Indian (1.5%, a difference of 0.48%), and Immigrants from Cambodia (1.5%, a difference of 0.53%).
| Demographics | Rating | Rank | Doctorate Degree |
| Apache | 1.3 /100 | #251 | Tragic 1.5% |
| Yuman | 1.1 /100 | #252 | Tragic 1.5% |
| Americans | 1.0 /100 | #253 | Tragic 1.5% |
| Immigrants | Cambodia | 1.0 /100 | #254 | Tragic 1.5% |
| Trinidadians and Tobagonians | 1.0 /100 | #255 | Tragic 1.5% |
| Central American Indians | 1.0 /100 | #256 | Tragic 1.5% |
| Chippewa | 0.9 /100 | #257 | Tragic 1.5% |
| Immigrants | West Indies | 0.9 /100 | #258 | Tragic 1.5% |
| Liberians | 0.9 /100 | #259 | Tragic 1.5% |
| Japanese | 0.9 /100 | #260 | Tragic 1.5% |
| Immigrants | Portugal | 0.8 /100 | #261 | Tragic 1.5% |
| Chickasaw | 0.7 /100 | #262 | Tragic 1.5% |
| Immigrants | Bahamas | 0.7 /100 | #263 | Tragic 1.5% |
| Blackfeet | 0.7 /100 | #264 | Tragic 1.5% |
| Nicaraguans | 0.6 /100 | #265 | Tragic 1.5% |
Demographics Similar to Cherokee by Doctorate Degree
In terms of doctorate degree, the demographic groups most similar to Cherokee are Cajun (1.5%, a difference of 0.17%), Malaysian (1.5%, a difference of 0.18%), Jamaican (1.5%, a difference of 0.21%), Central American (1.5%, a difference of 0.24%), and British West Indian (1.5%, a difference of 0.29%).
| Demographics | Rating | Rank | Doctorate Degree |
| Marshallese | 0.4 /100 | #279 | Tragic 1.5% |
| Ecuadorians | 0.4 /100 | #280 | Tragic 1.5% |
| Tohono O'odham | 0.4 /100 | #281 | Tragic 1.5% |
| British West Indians | 0.3 /100 | #282 | Tragic 1.5% |
| Central Americans | 0.3 /100 | #283 | Tragic 1.5% |
| Jamaicans | 0.3 /100 | #284 | Tragic 1.5% |
| Malaysians | 0.3 /100 | #285 | Tragic 1.5% |
| Cherokee | 0.3 /100 | #286 | Tragic 1.5% |
| Cajuns | 0.3 /100 | #287 | Tragic 1.5% |
| Immigrants | El Salvador | 0.3 /100 | #288 | Tragic 1.4% |
| Cape Verdeans | 0.3 /100 | #289 | Tragic 1.4% |
| Choctaw | 0.3 /100 | #290 | Tragic 1.4% |
| Blacks/African Americans | 0.3 /100 | #291 | Tragic 1.4% |
| Alaska Natives | 0.3 /100 | #292 | Tragic 1.4% |
| Immigrants | Yemen | 0.2 /100 | #293 | Tragic 1.4% |