Immigrants from West Indies vs Immigrants from Portugal Single Mother Poverty
COMPARE
Immigrants from West Indies
Immigrants from Portugal
Single Mother Poverty
Single Mother Poverty Comparison
Immigrants from West Indies
Immigrants from Portugal
31.1%
SINGLE MOTHER POVERTY
0.4/ 100
METRIC RATING
256th/ 347
METRIC RANK
30.5%
SINGLE MOTHER POVERTY
2.1/ 100
METRIC RATING
239th/ 347
METRIC RANK
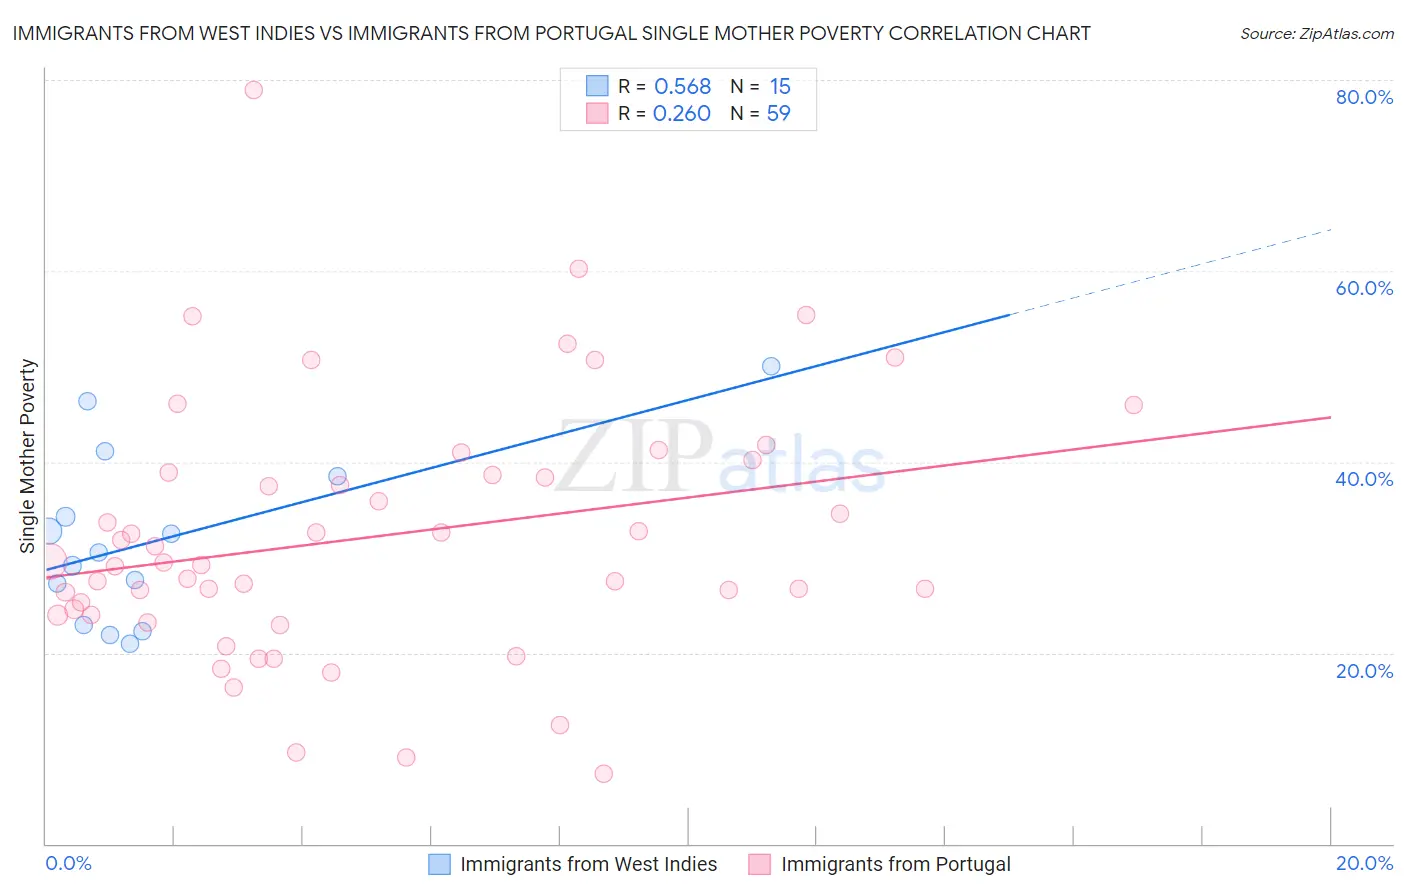
Immigrants from West Indies vs Immigrants from Portugal Single Mother Poverty Correlation Chart
The statistical analysis conducted on geographies consisting of 72,200,538 people shows a substantial positive correlation between the proportion of Immigrants from West Indies and poverty level among single mothers in the United States with a correlation coefficient (R) of 0.568 and weighted average of 31.1%. Similarly, the statistical analysis conducted on geographies consisting of 171,376,513 people shows a weak positive correlation between the proportion of Immigrants from Portugal and poverty level among single mothers in the United States with a correlation coefficient (R) of 0.260 and weighted average of 30.5%, a difference of 1.9%.
Single Mother Poverty Correlation Summary
| Measurement | Immigrants from West Indies | Immigrants from Portugal |
| Minimum | 21.0% | 7.4% |
| Maximum | 50.0% | 78.9% |
| Range | 29.0% | 71.6% |
| Mean | 31.9% | 32.2% |
| Median | 30.5% | 29.5% |
| Interquartile 25% (IQ1) | 22.9% | 23.9% |
| Interquartile 75% (IQ3) | 38.5% | 38.9% |
| Interquartile Range (IQR) | 15.5% | 15.0% |
| Standard Deviation (Sample) | 8.9% | 13.4% |
| Standard Deviation (Population) | 8.6% | 13.3% |
Demographics Similar to Immigrants from West Indies and Immigrants from Portugal by Single Mother Poverty
In terms of single mother poverty, the demographic groups most similar to Immigrants from West Indies are Immigrants from Bahamas (31.1%, a difference of 0.040%), Belizean (31.0%, a difference of 0.21%), Senegalese (31.0%, a difference of 0.32%), Celtic (30.9%, a difference of 0.46%), and Tlingit-Haida (30.9%, a difference of 0.50%). Similarly, the demographic groups most similar to Immigrants from Portugal are Salvadoran (30.6%, a difference of 0.13%), Immigrants from Laos (30.6%, a difference of 0.18%), Immigrants from Burma/Myanmar (30.6%, a difference of 0.20%), Bermudan (30.6%, a difference of 0.28%), and Slovak (30.4%, a difference of 0.36%).
| Demographics | Rating | Rank | Single Mother Poverty |
| Immigrants | St. Vincent and the Grenadines | 3.1 /100 | #237 | Tragic 30.4% |
| Slovaks | 2.8 /100 | #238 | Tragic 30.4% |
| Immigrants | Portugal | 2.1 /100 | #239 | Tragic 30.5% |
| Salvadorans | 1.8 /100 | #240 | Tragic 30.6% |
| Immigrants | Laos | 1.8 /100 | #241 | Tragic 30.6% |
| Immigrants | Burma/Myanmar | 1.7 /100 | #242 | Tragic 30.6% |
| Bermudans | 1.6 /100 | #243 | Tragic 30.6% |
| French | 1.3 /100 | #244 | Tragic 30.7% |
| Barbadians | 1.3 /100 | #245 | Tragic 30.7% |
| Ecuadorians | 0.9 /100 | #246 | Tragic 30.8% |
| West Indians | 0.9 /100 | #247 | Tragic 30.8% |
| French Canadians | 0.9 /100 | #248 | Tragic 30.8% |
| Cape Verdeans | 0.8 /100 | #249 | Tragic 30.8% |
| Vietnamese | 0.7 /100 | #250 | Tragic 30.9% |
| Tlingit-Haida | 0.6 /100 | #251 | Tragic 30.9% |
| Alaska Natives | 0.6 /100 | #252 | Tragic 30.9% |
| Celtics | 0.6 /100 | #253 | Tragic 30.9% |
| Senegalese | 0.5 /100 | #254 | Tragic 31.0% |
| Belizeans | 0.5 /100 | #255 | Tragic 31.0% |
| Immigrants | West Indies | 0.4 /100 | #256 | Tragic 31.1% |
| Immigrants | Bahamas | 0.4 /100 | #257 | Tragic 31.1% |