Immigrants from Vietnam vs Lithuanian Male Poverty
COMPARE
Immigrants from Vietnam
Lithuanian
Male Poverty
Male Poverty Comparison
Immigrants from Vietnam
Lithuanians
10.8%
MALE POVERTY
83.0/ 100
METRIC RATING
132nd/ 347
METRIC RANK
9.5%
MALE POVERTY
99.8/ 100
METRIC RATING
18th/ 347
METRIC RANK
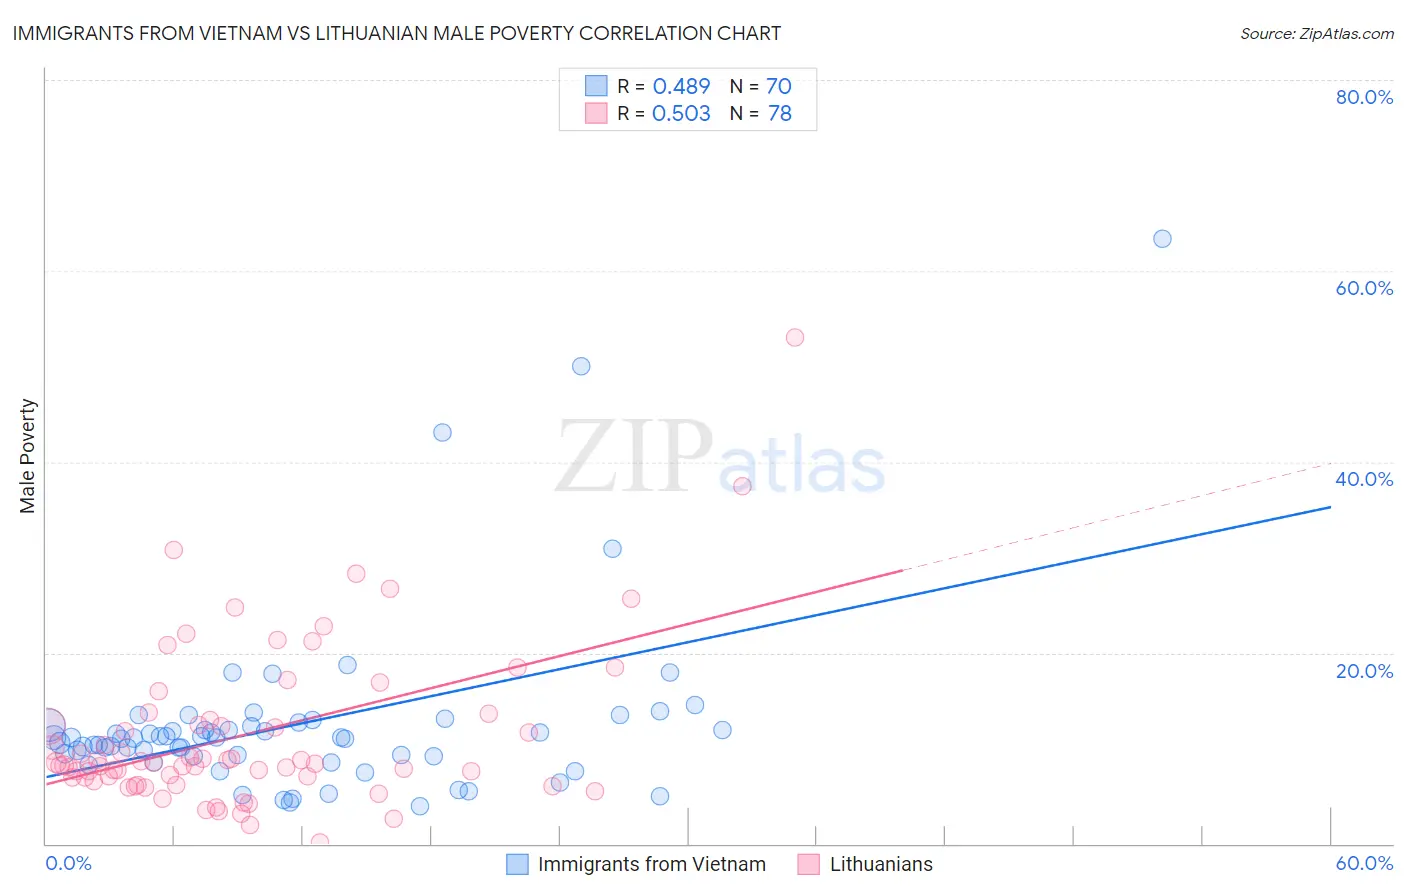
Immigrants from Vietnam vs Lithuanian Male Poverty Correlation Chart
The statistical analysis conducted on geographies consisting of 404,476,385 people shows a moderate positive correlation between the proportion of Immigrants from Vietnam and poverty level among males in the United States with a correlation coefficient (R) of 0.489 and weighted average of 10.8%. Similarly, the statistical analysis conducted on geographies consisting of 421,480,494 people shows a substantial positive correlation between the proportion of Lithuanians and poverty level among males in the United States with a correlation coefficient (R) of 0.503 and weighted average of 9.5%, a difference of 12.7%.
Male Poverty Correlation Summary
| Measurement | Immigrants from Vietnam | Lithuanian |
| Minimum | 4.0% | 0.15% |
| Maximum | 63.3% | 53.0% |
| Range | 59.4% | 52.8% |
| Mean | 12.6% | 11.4% |
| Median | 11.1% | 8.5% |
| Interquartile 25% (IQ1) | 9.2% | 6.9% |
| Interquartile 75% (IQ3) | 12.4% | 13.0% |
| Interquartile Range (IQR) | 3.2% | 6.0% |
| Standard Deviation (Sample) | 9.5% | 8.6% |
| Standard Deviation (Population) | 9.4% | 8.6% |
Similar Demographics by Male Poverty
Demographics Similar to Immigrants from Vietnam by Male Poverty
In terms of male poverty, the demographic groups most similar to Immigrants from Vietnam are Pakistani (10.8%, a difference of 0.010%), New Zealander (10.8%, a difference of 0.020%), Immigrants from Belarus (10.7%, a difference of 0.050%), Brazilian (10.8%, a difference of 0.060%), and Chilean (10.7%, a difference of 0.16%).
| Demographics | Rating | Rank | Male Poverty |
| Immigrants | Norway | 86.0 /100 | #125 | Excellent 10.7% |
| Immigrants | Ukraine | 84.3 /100 | #126 | Excellent 10.7% |
| Puget Sound Salish | 84.3 /100 | #127 | Excellent 10.7% |
| Immigrants | Western Europe | 84.2 /100 | #128 | Excellent 10.7% |
| Immigrants | Peru | 84.1 /100 | #129 | Excellent 10.7% |
| Chileans | 83.9 /100 | #130 | Excellent 10.7% |
| Immigrants | Belarus | 83.3 /100 | #131 | Excellent 10.7% |
| Immigrants | Vietnam | 83.0 /100 | #132 | Excellent 10.8% |
| Pakistanis | 83.0 /100 | #133 | Excellent 10.8% |
| New Zealanders | 82.9 /100 | #134 | Excellent 10.8% |
| Brazilians | 82.7 /100 | #135 | Excellent 10.8% |
| Immigrants | Israel | 80.9 /100 | #136 | Excellent 10.8% |
| Immigrants | Switzerland | 79.2 /100 | #137 | Good 10.8% |
| Yugoslavians | 78.2 /100 | #138 | Good 10.8% |
| Immigrants | Jordan | 77.5 /100 | #139 | Good 10.8% |
Demographics Similar to Lithuanians by Male Poverty
In terms of male poverty, the demographic groups most similar to Lithuanians are Norwegian (9.5%, a difference of 0.17%), Immigrants from Hong Kong (9.6%, a difference of 0.18%), Latvian (9.6%, a difference of 0.28%), Luxembourger (9.5%, a difference of 0.30%), and Immigrants from Scotland (9.6%, a difference of 0.55%).
| Demographics | Rating | Rank | Male Poverty |
| Bolivians | 99.9 /100 | #11 | Exceptional 9.4% |
| Immigrants | Bolivia | 99.9 /100 | #12 | Exceptional 9.4% |
| Immigrants | Lithuania | 99.9 /100 | #13 | Exceptional 9.4% |
| Immigrants | North Macedonia | 99.8 /100 | #14 | Exceptional 9.4% |
| Bhutanese | 99.8 /100 | #15 | Exceptional 9.5% |
| Luxembourgers | 99.8 /100 | #16 | Exceptional 9.5% |
| Norwegians | 99.8 /100 | #17 | Exceptional 9.5% |
| Lithuanians | 99.8 /100 | #18 | Exceptional 9.5% |
| Immigrants | Hong Kong | 99.7 /100 | #19 | Exceptional 9.6% |
| Latvians | 99.7 /100 | #20 | Exceptional 9.6% |
| Immigrants | Scotland | 99.7 /100 | #21 | Exceptional 9.6% |
| Croatians | 99.7 /100 | #22 | Exceptional 9.6% |
| Italians | 99.7 /100 | #23 | Exceptional 9.6% |
| Swedes | 99.7 /100 | #24 | Exceptional 9.6% |
| Eastern Europeans | 99.6 /100 | #25 | Exceptional 9.6% |