Immigrants from Vietnam vs Immigrants from Ecuador Male Poverty
COMPARE
Immigrants from Vietnam
Immigrants from Ecuador
Male Poverty
Male Poverty Comparison
Immigrants from Vietnam
Immigrants from Ecuador
10.8%
MALE POVERTY
83.0/ 100
METRIC RATING
132nd/ 347
METRIC RANK
12.9%
MALE POVERTY
0.2/ 100
METRIC RATING
252nd/ 347
METRIC RANK
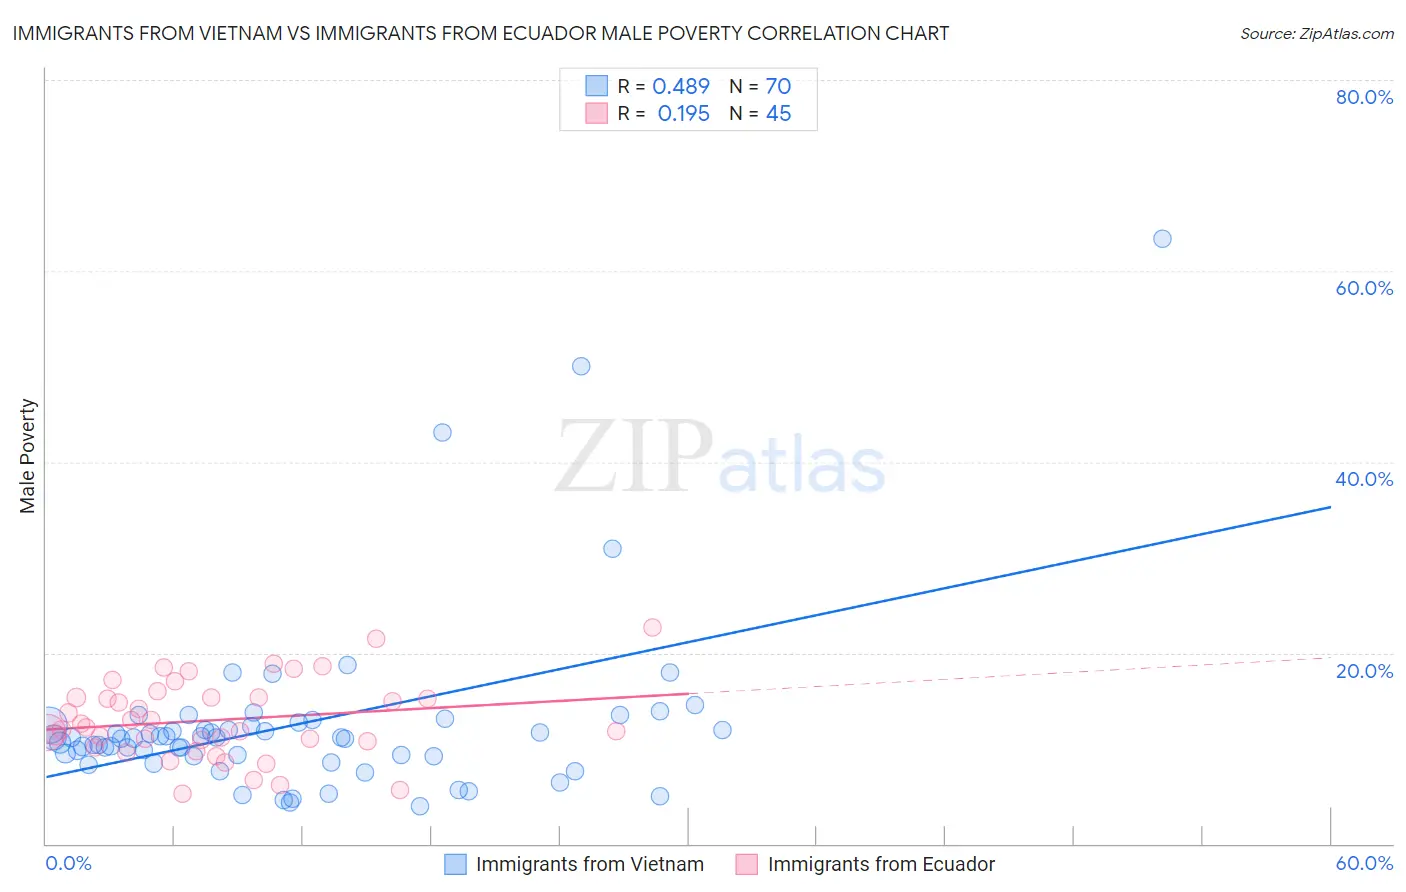
Immigrants from Vietnam vs Immigrants from Ecuador Male Poverty Correlation Chart
The statistical analysis conducted on geographies consisting of 404,476,385 people shows a moderate positive correlation between the proportion of Immigrants from Vietnam and poverty level among males in the United States with a correlation coefficient (R) of 0.489 and weighted average of 10.8%. Similarly, the statistical analysis conducted on geographies consisting of 270,825,114 people shows a poor positive correlation between the proportion of Immigrants from Ecuador and poverty level among males in the United States with a correlation coefficient (R) of 0.195 and weighted average of 12.9%, a difference of 20.2%.
Male Poverty Correlation Summary
| Measurement | Immigrants from Vietnam | Immigrants from Ecuador |
| Minimum | 4.0% | 5.2% |
| Maximum | 63.3% | 22.6% |
| Range | 59.4% | 17.4% |
| Mean | 12.6% | 13.0% |
| Median | 11.1% | 12.1% |
| Interquartile 25% (IQ1) | 9.2% | 10.4% |
| Interquartile 75% (IQ3) | 12.4% | 15.4% |
| Interquartile Range (IQR) | 3.2% | 4.9% |
| Standard Deviation (Sample) | 9.5% | 4.1% |
| Standard Deviation (Population) | 9.4% | 4.0% |
Similar Demographics by Male Poverty
Demographics Similar to Immigrants from Vietnam by Male Poverty
In terms of male poverty, the demographic groups most similar to Immigrants from Vietnam are Pakistani (10.8%, a difference of 0.010%), New Zealander (10.8%, a difference of 0.020%), Immigrants from Belarus (10.7%, a difference of 0.050%), Brazilian (10.8%, a difference of 0.060%), and Chilean (10.7%, a difference of 0.16%).
| Demographics | Rating | Rank | Male Poverty |
| Immigrants | Norway | 86.0 /100 | #125 | Excellent 10.7% |
| Immigrants | Ukraine | 84.3 /100 | #126 | Excellent 10.7% |
| Puget Sound Salish | 84.3 /100 | #127 | Excellent 10.7% |
| Immigrants | Western Europe | 84.2 /100 | #128 | Excellent 10.7% |
| Immigrants | Peru | 84.1 /100 | #129 | Excellent 10.7% |
| Chileans | 83.9 /100 | #130 | Excellent 10.7% |
| Immigrants | Belarus | 83.3 /100 | #131 | Excellent 10.7% |
| Immigrants | Vietnam | 83.0 /100 | #132 | Excellent 10.8% |
| Pakistanis | 83.0 /100 | #133 | Excellent 10.8% |
| New Zealanders | 82.9 /100 | #134 | Excellent 10.8% |
| Brazilians | 82.7 /100 | #135 | Excellent 10.8% |
| Immigrants | Israel | 80.9 /100 | #136 | Excellent 10.8% |
| Immigrants | Switzerland | 79.2 /100 | #137 | Good 10.8% |
| Yugoslavians | 78.2 /100 | #138 | Good 10.8% |
| Immigrants | Jordan | 77.5 /100 | #139 | Good 10.8% |
Demographics Similar to Immigrants from Ecuador by Male Poverty
In terms of male poverty, the demographic groups most similar to Immigrants from Ecuador are Immigrants from Cuba (12.9%, a difference of 0.030%), Immigrants from Ghana (12.9%, a difference of 0.050%), Immigrants from Nicaragua (12.9%, a difference of 0.13%), Potawatomi (12.9%, a difference of 0.14%), and Immigrants from Sudan (12.9%, a difference of 0.21%).
| Demographics | Rating | Rank | Male Poverty |
| Liberians | 0.3 /100 | #245 | Tragic 12.8% |
| Immigrants | El Salvador | 0.2 /100 | #246 | Tragic 12.8% |
| Immigrants | Western Africa | 0.2 /100 | #247 | Tragic 12.9% |
| Immigrants | Sudan | 0.2 /100 | #248 | Tragic 12.9% |
| Potawatomi | 0.2 /100 | #249 | Tragic 12.9% |
| Immigrants | Nicaragua | 0.2 /100 | #250 | Tragic 12.9% |
| Immigrants | Cuba | 0.2 /100 | #251 | Tragic 12.9% |
| Immigrants | Ecuador | 0.2 /100 | #252 | Tragic 12.9% |
| Immigrants | Ghana | 0.2 /100 | #253 | Tragic 12.9% |
| Mexican American Indians | 0.1 /100 | #254 | Tragic 13.0% |
| Immigrants | Liberia | 0.1 /100 | #255 | Tragic 13.0% |
| Immigrants | Burma/Myanmar | 0.1 /100 | #256 | Tragic 13.0% |
| Immigrants | Trinidad and Tobago | 0.1 /100 | #257 | Tragic 13.1% |
| Cape Verdeans | 0.1 /100 | #258 | Tragic 13.1% |
| Cherokee | 0.1 /100 | #259 | Tragic 13.1% |