Immigrants from Guatemala vs Lithuanian Male Poverty
COMPARE
Immigrants from Guatemala
Lithuanian
Male Poverty
Male Poverty Comparison
Immigrants from Guatemala
Lithuanians
14.0%
MALE POVERTY
0.0/ 100
METRIC RATING
299th/ 347
METRIC RANK
9.5%
MALE POVERTY
99.8/ 100
METRIC RATING
18th/ 347
METRIC RANK
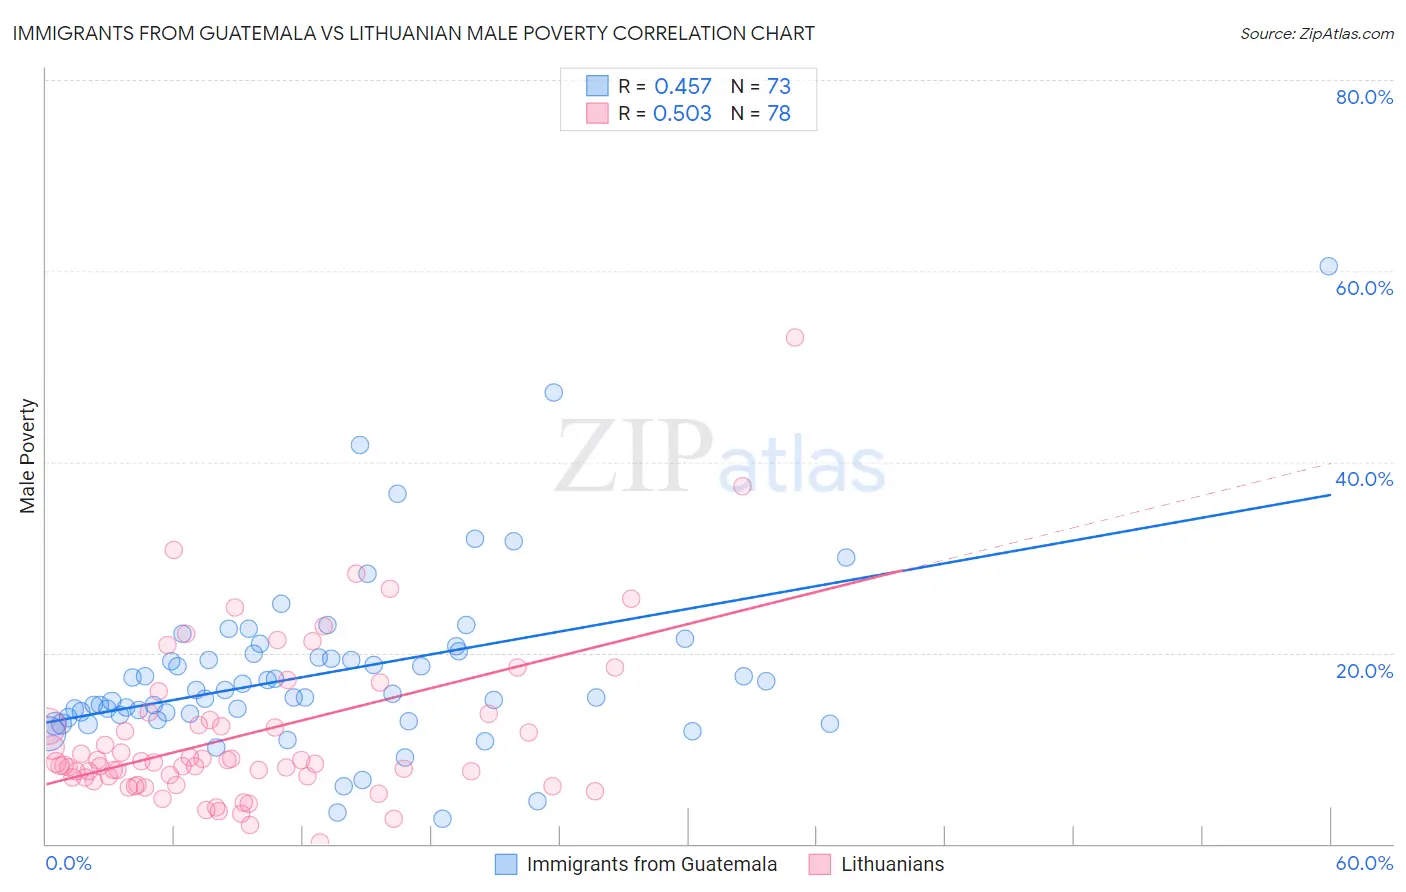
Immigrants from Guatemala vs Lithuanian Male Poverty Correlation Chart
The statistical analysis conducted on geographies consisting of 377,090,966 people shows a moderate positive correlation between the proportion of Immigrants from Guatemala and poverty level among males in the United States with a correlation coefficient (R) of 0.457 and weighted average of 14.0%. Similarly, the statistical analysis conducted on geographies consisting of 421,480,494 people shows a substantial positive correlation between the proportion of Lithuanians and poverty level among males in the United States with a correlation coefficient (R) of 0.503 and weighted average of 9.5%, a difference of 46.9%.
Male Poverty Correlation Summary
| Measurement | Immigrants from Guatemala | Lithuanian |
| Minimum | 2.7% | 0.15% |
| Maximum | 60.5% | 53.0% |
| Range | 57.9% | 52.8% |
| Mean | 17.9% | 11.4% |
| Median | 15.7% | 8.5% |
| Interquartile 25% (IQ1) | 13.4% | 6.9% |
| Interquartile 75% (IQ3) | 20.1% | 13.0% |
| Interquartile Range (IQR) | 6.7% | 6.0% |
| Standard Deviation (Sample) | 9.2% | 8.6% |
| Standard Deviation (Population) | 9.1% | 8.6% |
Similar Demographics by Male Poverty
Demographics Similar to Immigrants from Guatemala by Male Poverty
In terms of male poverty, the demographic groups most similar to Immigrants from Guatemala are Blackfeet (14.0%, a difference of 0.10%), Immigrants from Mexico (14.0%, a difference of 0.12%), Inupiat (14.0%, a difference of 0.13%), Immigrants from Senegal (14.0%, a difference of 0.18%), and Immigrants from Caribbean (14.0%, a difference of 0.24%).
| Demographics | Rating | Rank | Male Poverty |
| Indonesians | 0.0 /100 | #292 | Tragic 13.8% |
| Immigrants | Belize | 0.0 /100 | #293 | Tragic 13.8% |
| Hispanics or Latinos | 0.0 /100 | #294 | Tragic 13.9% |
| Immigrants | Central America | 0.0 /100 | #295 | Tragic 13.9% |
| Cajuns | 0.0 /100 | #296 | Tragic 13.9% |
| Inupiat | 0.0 /100 | #297 | Tragic 14.0% |
| Blackfeet | 0.0 /100 | #298 | Tragic 14.0% |
| Immigrants | Guatemala | 0.0 /100 | #299 | Tragic 14.0% |
| Immigrants | Mexico | 0.0 /100 | #300 | Tragic 14.0% |
| Immigrants | Senegal | 0.0 /100 | #301 | Tragic 14.0% |
| Immigrants | Caribbean | 0.0 /100 | #302 | Tragic 14.0% |
| Bahamians | 0.0 /100 | #303 | Tragic 14.1% |
| Senegalese | 0.0 /100 | #304 | Tragic 14.1% |
| Immigrants | Bangladesh | 0.0 /100 | #305 | Tragic 14.1% |
| Creek | 0.0 /100 | #306 | Tragic 14.1% |
Demographics Similar to Lithuanians by Male Poverty
In terms of male poverty, the demographic groups most similar to Lithuanians are Norwegian (9.5%, a difference of 0.17%), Immigrants from Hong Kong (9.6%, a difference of 0.18%), Latvian (9.6%, a difference of 0.28%), Luxembourger (9.5%, a difference of 0.30%), and Immigrants from Scotland (9.6%, a difference of 0.55%).
| Demographics | Rating | Rank | Male Poverty |
| Bolivians | 99.9 /100 | #11 | Exceptional 9.4% |
| Immigrants | Bolivia | 99.9 /100 | #12 | Exceptional 9.4% |
| Immigrants | Lithuania | 99.9 /100 | #13 | Exceptional 9.4% |
| Immigrants | North Macedonia | 99.8 /100 | #14 | Exceptional 9.4% |
| Bhutanese | 99.8 /100 | #15 | Exceptional 9.5% |
| Luxembourgers | 99.8 /100 | #16 | Exceptional 9.5% |
| Norwegians | 99.8 /100 | #17 | Exceptional 9.5% |
| Lithuanians | 99.8 /100 | #18 | Exceptional 9.5% |
| Immigrants | Hong Kong | 99.7 /100 | #19 | Exceptional 9.6% |
| Latvians | 99.7 /100 | #20 | Exceptional 9.6% |
| Immigrants | Scotland | 99.7 /100 | #21 | Exceptional 9.6% |
| Croatians | 99.7 /100 | #22 | Exceptional 9.6% |
| Italians | 99.7 /100 | #23 | Exceptional 9.6% |
| Swedes | 99.7 /100 | #24 | Exceptional 9.6% |
| Eastern Europeans | 99.6 /100 | #25 | Exceptional 9.6% |