Immigrants from Vietnam vs Bahamian Male Poverty
COMPARE
Immigrants from Vietnam
Bahamian
Male Poverty
Male Poverty Comparison
Immigrants from Vietnam
Bahamians
10.8%
MALE POVERTY
83.0/ 100
METRIC RATING
132nd/ 347
METRIC RANK
14.1%
MALE POVERTY
0.0/ 100
METRIC RATING
303rd/ 347
METRIC RANK
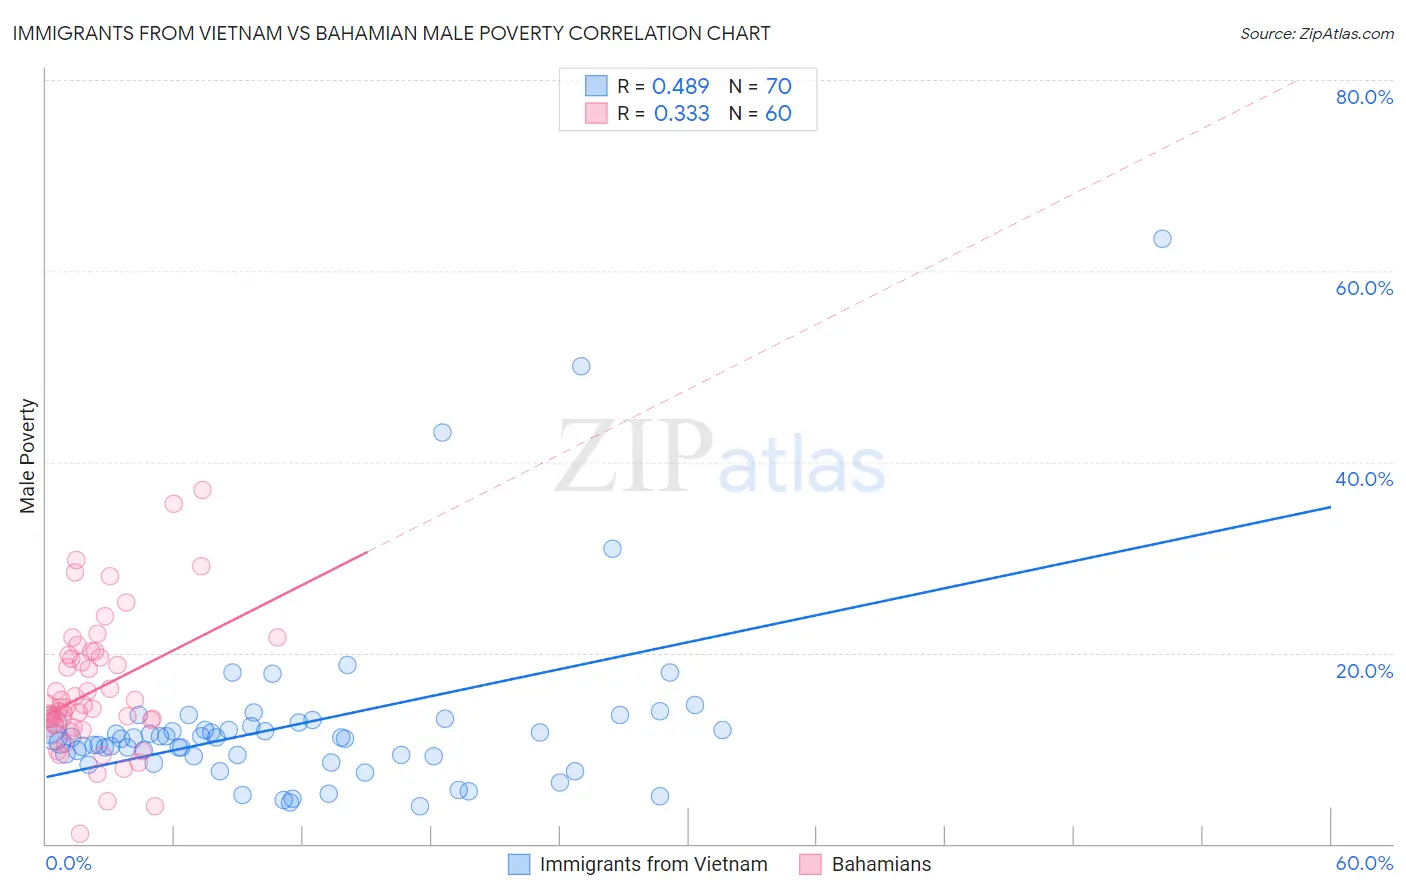
Immigrants from Vietnam vs Bahamian Male Poverty Correlation Chart
The statistical analysis conducted on geographies consisting of 404,476,385 people shows a moderate positive correlation between the proportion of Immigrants from Vietnam and poverty level among males in the United States with a correlation coefficient (R) of 0.489 and weighted average of 10.8%. Similarly, the statistical analysis conducted on geographies consisting of 112,626,809 people shows a mild positive correlation between the proportion of Bahamians and poverty level among males in the United States with a correlation coefficient (R) of 0.333 and weighted average of 14.1%, a difference of 30.7%.
Male Poverty Correlation Summary
| Measurement | Immigrants from Vietnam | Bahamian |
| Minimum | 4.0% | 1.1% |
| Maximum | 63.3% | 37.0% |
| Range | 59.4% | 35.9% |
| Mean | 12.6% | 16.1% |
| Median | 11.1% | 14.3% |
| Interquartile 25% (IQ1) | 9.2% | 12.3% |
| Interquartile 75% (IQ3) | 12.4% | 19.6% |
| Interquartile Range (IQR) | 3.2% | 7.3% |
| Standard Deviation (Sample) | 9.5% | 7.1% |
| Standard Deviation (Population) | 9.4% | 7.0% |
Similar Demographics by Male Poverty
Demographics Similar to Immigrants from Vietnam by Male Poverty
In terms of male poverty, the demographic groups most similar to Immigrants from Vietnam are Pakistani (10.8%, a difference of 0.010%), New Zealander (10.8%, a difference of 0.020%), Immigrants from Belarus (10.7%, a difference of 0.050%), Brazilian (10.8%, a difference of 0.060%), and Chilean (10.7%, a difference of 0.16%).
| Demographics | Rating | Rank | Male Poverty |
| Immigrants | Norway | 86.0 /100 | #125 | Excellent 10.7% |
| Immigrants | Ukraine | 84.3 /100 | #126 | Excellent 10.7% |
| Puget Sound Salish | 84.3 /100 | #127 | Excellent 10.7% |
| Immigrants | Western Europe | 84.2 /100 | #128 | Excellent 10.7% |
| Immigrants | Peru | 84.1 /100 | #129 | Excellent 10.7% |
| Chileans | 83.9 /100 | #130 | Excellent 10.7% |
| Immigrants | Belarus | 83.3 /100 | #131 | Excellent 10.7% |
| Immigrants | Vietnam | 83.0 /100 | #132 | Excellent 10.8% |
| Pakistanis | 83.0 /100 | #133 | Excellent 10.8% |
| New Zealanders | 82.9 /100 | #134 | Excellent 10.8% |
| Brazilians | 82.7 /100 | #135 | Excellent 10.8% |
| Immigrants | Israel | 80.9 /100 | #136 | Excellent 10.8% |
| Immigrants | Switzerland | 79.2 /100 | #137 | Good 10.8% |
| Yugoslavians | 78.2 /100 | #138 | Good 10.8% |
| Immigrants | Jordan | 77.5 /100 | #139 | Good 10.8% |
Demographics Similar to Bahamians by Male Poverty
In terms of male poverty, the demographic groups most similar to Bahamians are Immigrants from Caribbean (14.0%, a difference of 0.040%), Immigrants from Senegal (14.0%, a difference of 0.10%), Senegalese (14.1%, a difference of 0.10%), Immigrants from Mexico (14.0%, a difference of 0.17%), and Immigrants from Guatemala (14.0%, a difference of 0.28%).
| Demographics | Rating | Rank | Male Poverty |
| Cajuns | 0.0 /100 | #296 | Tragic 13.9% |
| Inupiat | 0.0 /100 | #297 | Tragic 14.0% |
| Blackfeet | 0.0 /100 | #298 | Tragic 14.0% |
| Immigrants | Guatemala | 0.0 /100 | #299 | Tragic 14.0% |
| Immigrants | Mexico | 0.0 /100 | #300 | Tragic 14.0% |
| Immigrants | Senegal | 0.0 /100 | #301 | Tragic 14.0% |
| Immigrants | Caribbean | 0.0 /100 | #302 | Tragic 14.0% |
| Bahamians | 0.0 /100 | #303 | Tragic 14.1% |
| Senegalese | 0.0 /100 | #304 | Tragic 14.1% |
| Immigrants | Bangladesh | 0.0 /100 | #305 | Tragic 14.1% |
| Creek | 0.0 /100 | #306 | Tragic 14.1% |
| Dutch West Indians | 0.0 /100 | #307 | Tragic 14.2% |
| Africans | 0.0 /100 | #308 | Tragic 14.2% |
| Somalis | 0.0 /100 | #309 | Tragic 14.3% |
| Seminole | 0.0 /100 | #310 | Tragic 14.3% |