Immigrants from Ukraine vs Puget Sound Salish 3rd Grade
COMPARE
Immigrants from Ukraine
Puget Sound Salish
3rd Grade
3rd Grade Comparison
Immigrants from Ukraine
Puget Sound Salish
97.7%
3RD GRADE
22.7/ 100
METRIC RATING
199th/ 347
METRIC RANK
98.1%
3RD GRADE
97.9/ 100
METRIC RATING
101st/ 347
METRIC RANK
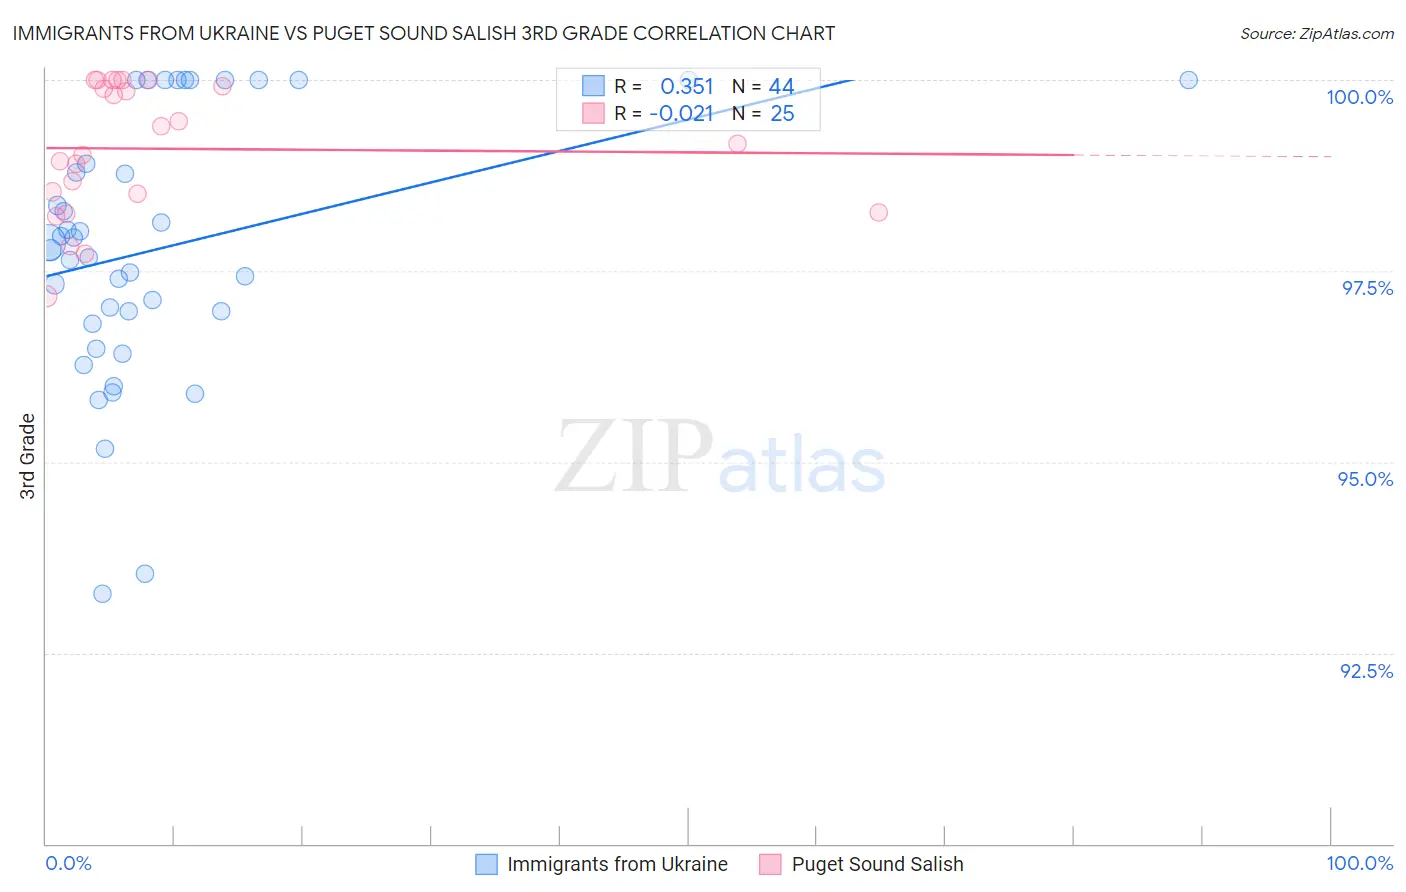
Immigrants from Ukraine vs Puget Sound Salish 3rd Grade Correlation Chart
The statistical analysis conducted on geographies consisting of 289,712,791 people shows a mild positive correlation between the proportion of Immigrants from Ukraine and percentage of population with at least 3rd grade education in the United States with a correlation coefficient (R) of 0.351 and weighted average of 97.7%. Similarly, the statistical analysis conducted on geographies consisting of 46,155,746 people shows no correlation between the proportion of Puget Sound Salish and percentage of population with at least 3rd grade education in the United States with a correlation coefficient (R) of -0.021 and weighted average of 98.1%, a difference of 0.43%.
3rd Grade Correlation Summary
| Measurement | Immigrants from Ukraine | Puget Sound Salish |
| Minimum | 93.3% | 97.2% |
| Maximum | 100.0% | 100.0% |
| Range | 6.7% | 2.8% |
| Mean | 97.8% | 99.1% |
| Median | 97.8% | 99.2% |
| Interquartile 25% (IQ1) | 96.9% | 98.4% |
| Interquartile 75% (IQ3) | 99.4% | 100.0% |
| Interquartile Range (IQR) | 2.6% | 1.6% |
| Standard Deviation (Sample) | 1.7% | 0.86% |
| Standard Deviation (Population) | 1.7% | 0.84% |
Similar Demographics by 3rd Grade
Demographics Similar to Immigrants from Ukraine by 3rd Grade
In terms of 3rd grade, the demographic groups most similar to Immigrants from Ukraine are Guamanian/Chamorro (97.7%, a difference of 0.0%), Immigrants from Albania (97.7%, a difference of 0.0%), Hawaiian (97.7%, a difference of 0.010%), Immigrants from Lebanon (97.7%, a difference of 0.010%), and Immigrants from Kenya (97.7%, a difference of 0.020%).
| Demographics | Rating | Rank | 3rd Grade |
| Mongolians | 29.1 /100 | #192 | Fair 97.7% |
| Immigrants | Kenya | 28.2 /100 | #193 | Fair 97.7% |
| Immigrants | Uganda | 27.4 /100 | #194 | Fair 97.7% |
| Immigrants | Egypt | 26.8 /100 | #195 | Fair 97.7% |
| Paraguayans | 26.2 /100 | #196 | Fair 97.7% |
| Hawaiians | 25.7 /100 | #197 | Fair 97.7% |
| Guamanians/Chamorros | 23.6 /100 | #198 | Fair 97.7% |
| Immigrants | Ukraine | 22.7 /100 | #199 | Fair 97.7% |
| Immigrants | Albania | 22.6 /100 | #200 | Fair 97.7% |
| Immigrants | Lebanon | 21.7 /100 | #201 | Fair 97.7% |
| Immigrants | Southern Europe | 17.7 /100 | #202 | Poor 97.6% |
| Paiute | 16.7 /100 | #203 | Poor 97.6% |
| Immigrants | Chile | 16.5 /100 | #204 | Poor 97.6% |
| Africans | 14.5 /100 | #205 | Poor 97.6% |
| Immigrants | Northern Africa | 13.0 /100 | #206 | Poor 97.6% |
Demographics Similar to Puget Sound Salish by 3rd Grade
In terms of 3rd grade, the demographic groups most similar to Puget Sound Salish are Romanian (98.1%, a difference of 0.0%), Cree (98.1%, a difference of 0.0%), Nonimmigrants (98.1%, a difference of 0.0%), South African (98.1%, a difference of 0.010%), and Choctaw (98.1%, a difference of 0.010%).
| Demographics | Rating | Rank | 3rd Grade |
| Immigrants | Germany | 98.4 /100 | #94 | Exceptional 98.1% |
| Cypriots | 98.4 /100 | #95 | Exceptional 98.1% |
| Immigrants | Ireland | 98.2 /100 | #96 | Exceptional 98.1% |
| South Africans | 98.2 /100 | #97 | Exceptional 98.1% |
| Choctaw | 98.0 /100 | #98 | Exceptional 98.1% |
| Romanians | 98.0 /100 | #99 | Exceptional 98.1% |
| Cree | 97.9 /100 | #100 | Exceptional 98.1% |
| Puget Sound Salish | 97.9 /100 | #101 | Exceptional 98.1% |
| Immigrants | Nonimmigrants | 97.8 /100 | #102 | Exceptional 98.1% |
| Yugoslavians | 97.7 /100 | #103 | Exceptional 98.1% |
| Turks | 97.6 /100 | #104 | Exceptional 98.1% |
| German Russians | 97.2 /100 | #105 | Exceptional 98.1% |
| Bhutanese | 97.2 /100 | #106 | Exceptional 98.1% |
| Immigrants | Czechoslovakia | 97.0 /100 | #107 | Exceptional 98.0% |
| Immigrants | Singapore | 96.7 /100 | #108 | Exceptional 98.0% |