Immigrants from Uganda vs Kiowa Poverty
COMPARE
Immigrants from Uganda
Kiowa
Poverty
Poverty Comparison
Immigrants from Uganda
Kiowa
12.8%
POVERTY
16.5/ 100
METRIC RATING
201st/ 347
METRIC RANK
16.8%
POVERTY
0.0/ 100
METRIC RATING
327th/ 347
METRIC RANK
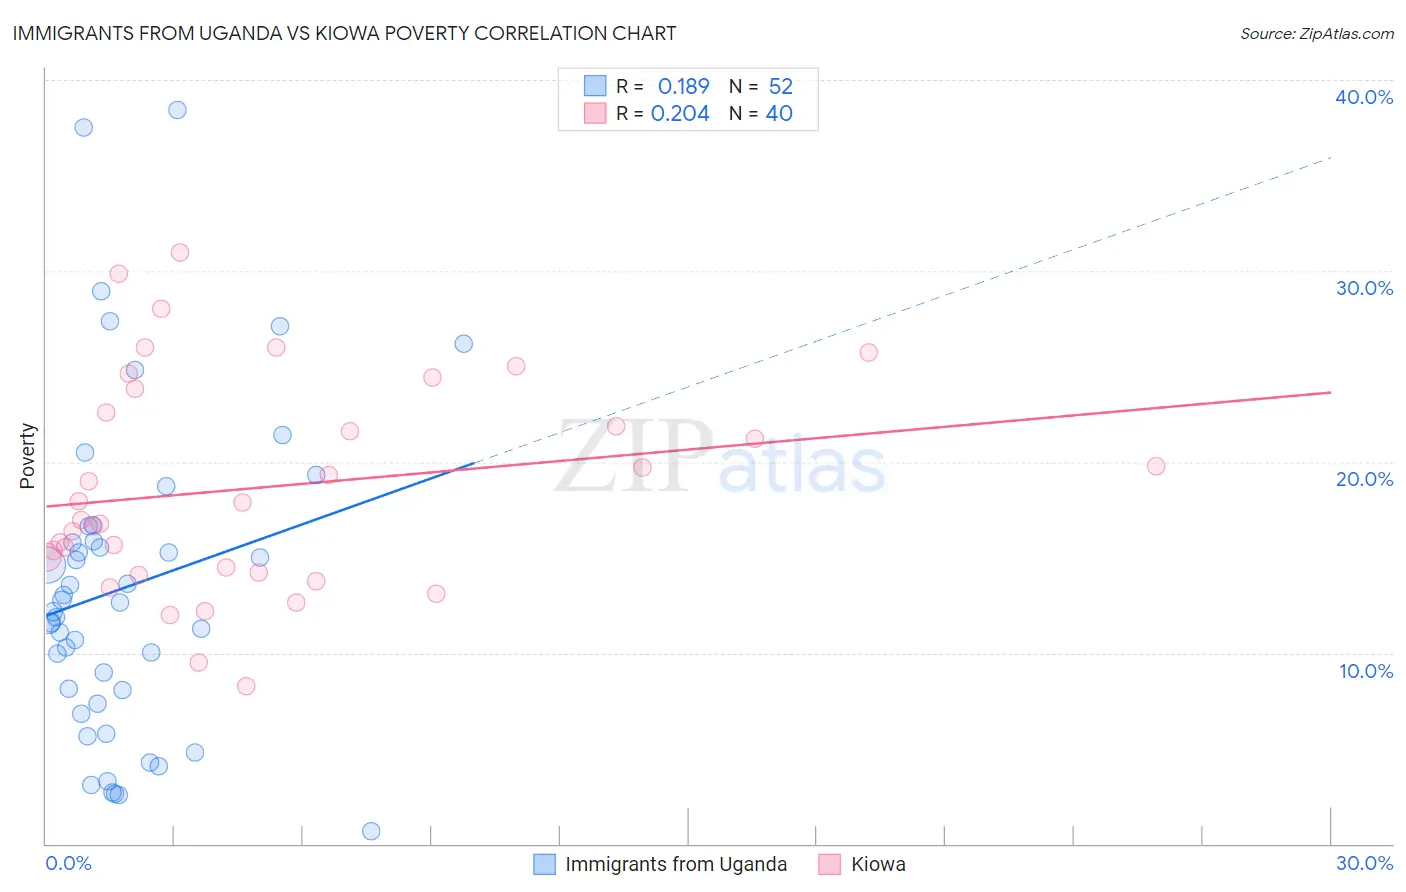
Immigrants from Uganda vs Kiowa Poverty Correlation Chart
The statistical analysis conducted on geographies consisting of 125,970,249 people shows a poor positive correlation between the proportion of Immigrants from Uganda and poverty level in the United States with a correlation coefficient (R) of 0.189 and weighted average of 12.8%. Similarly, the statistical analysis conducted on geographies consisting of 56,099,000 people shows a weak positive correlation between the proportion of Kiowa and poverty level in the United States with a correlation coefficient (R) of 0.204 and weighted average of 16.8%, a difference of 31.5%.
Poverty Correlation Summary
| Measurement | Immigrants from Uganda | Kiowa |
| Minimum | 0.63% | 8.3% |
| Maximum | 38.4% | 31.0% |
| Range | 37.8% | 22.7% |
| Mean | 13.5% | 18.7% |
| Median | 12.4% | 17.4% |
| Interquartile 25% (IQ1) | 7.7% | 14.3% |
| Interquartile 75% (IQ3) | 16.2% | 23.2% |
| Interquartile Range (IQR) | 8.6% | 8.9% |
| Standard Deviation (Sample) | 8.5% | 5.6% |
| Standard Deviation (Population) | 8.4% | 5.5% |
Similar Demographics by Poverty
Demographics Similar to Immigrants from Uganda by Poverty
In terms of poverty, the demographic groups most similar to Immigrants from Uganda are Spaniard (12.8%, a difference of 0.0%), Immigrants from Kenya (12.8%, a difference of 0.16%), Immigrants from Uruguay (12.8%, a difference of 0.16%), Hmong (12.8%, a difference of 0.26%), and Immigrants from Lebanon (12.8%, a difference of 0.35%).
| Demographics | Rating | Rank | Poverty |
| Arabs | 21.1 /100 | #194 | Fair 12.7% |
| Immigrants | Kuwait | 20.9 /100 | #195 | Fair 12.7% |
| Iraqis | 20.8 /100 | #196 | Fair 12.7% |
| Immigrants | Lebanon | 18.7 /100 | #197 | Poor 12.8% |
| Spanish | 18.7 /100 | #198 | Poor 12.8% |
| Immigrants | Kenya | 17.5 /100 | #199 | Poor 12.8% |
| Spaniards | 16.5 /100 | #200 | Poor 12.8% |
| Immigrants | Uganda | 16.5 /100 | #201 | Poor 12.8% |
| Immigrants | Uruguay | 15.6 /100 | #202 | Poor 12.8% |
| Hmong | 15.0 /100 | #203 | Poor 12.8% |
| Immigrants | Western Asia | 14.1 /100 | #204 | Poor 12.9% |
| Tsimshian | 9.2 /100 | #205 | Tragic 13.0% |
| Immigrants | Eastern Africa | 7.0 /100 | #206 | Tragic 13.1% |
| Panamanians | 6.6 /100 | #207 | Tragic 13.1% |
| Ugandans | 6.2 /100 | #208 | Tragic 13.1% |
Demographics Similar to Kiowa by Poverty
In terms of poverty, the demographic groups most similar to Kiowa are Ute (16.9%, a difference of 0.43%), Paiute (16.7%, a difference of 0.53%), Central American Indian (16.7%, a difference of 0.82%), Yakama (16.7%, a difference of 1.1%), and Colville (16.6%, a difference of 1.6%).
| Demographics | Rating | Rank | Poverty |
| Immigrants | Honduras | 0.0 /100 | #320 | Tragic 16.2% |
| Arapaho | 0.0 /100 | #321 | Tragic 16.3% |
| Menominee | 0.0 /100 | #322 | Tragic 16.4% |
| Colville | 0.0 /100 | #323 | Tragic 16.6% |
| Yakama | 0.0 /100 | #324 | Tragic 16.7% |
| Central American Indians | 0.0 /100 | #325 | Tragic 16.7% |
| Paiute | 0.0 /100 | #326 | Tragic 16.7% |
| Kiowa | 0.0 /100 | #327 | Tragic 16.8% |
| Ute | 0.0 /100 | #328 | Tragic 16.9% |
| Blacks/African Americans | 0.0 /100 | #329 | Tragic 17.3% |
| Dominicans | 0.0 /100 | #330 | Tragic 17.6% |
| Immigrants | Dominican Republic | 0.0 /100 | #331 | Tragic 17.8% |
| Natives/Alaskans | 0.0 /100 | #332 | Tragic 18.1% |
| Houma | 0.0 /100 | #333 | Tragic 18.4% |
| Apache | 0.0 /100 | #334 | Tragic 18.4% |