Immigrants from Cabo Verde vs Central American Poverty
COMPARE
Immigrants from Cabo Verde
Central American
Poverty
Poverty Comparison
Immigrants from Cabo Verde
Central Americans
15.1%
POVERTY
0.0/ 100
METRIC RATING
291st/ 347
METRIC RANK
14.6%
POVERTY
0.1/ 100
METRIC RATING
270th/ 347
METRIC RANK
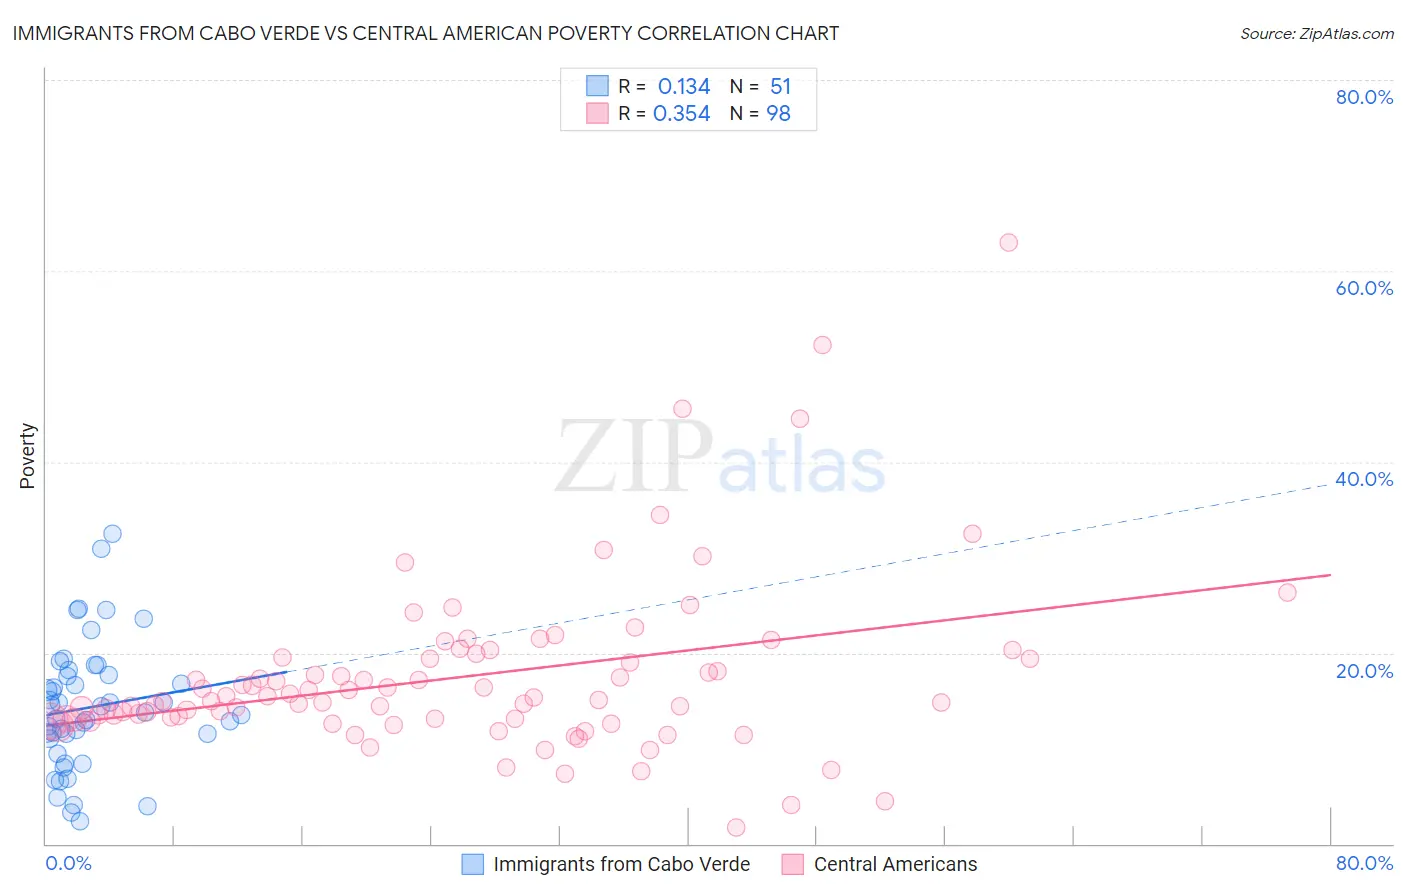
Immigrants from Cabo Verde vs Central American Poverty Correlation Chart
The statistical analysis conducted on geographies consisting of 38,149,486 people shows a poor positive correlation between the proportion of Immigrants from Cabo Verde and poverty level in the United States with a correlation coefficient (R) of 0.134 and weighted average of 15.1%. Similarly, the statistical analysis conducted on geographies consisting of 504,069,914 people shows a mild positive correlation between the proportion of Central Americans and poverty level in the United States with a correlation coefficient (R) of 0.354 and weighted average of 14.6%, a difference of 3.7%.
Poverty Correlation Summary
| Measurement | Immigrants from Cabo Verde | Central American |
| Minimum | 2.3% | 1.8% |
| Maximum | 32.5% | 62.9% |
| Range | 30.1% | 61.2% |
| Mean | 14.3% | 17.4% |
| Median | 13.7% | 15.0% |
| Interquartile 25% (IQ1) | 11.0% | 13.0% |
| Interquartile 75% (IQ3) | 17.6% | 19.4% |
| Interquartile Range (IQR) | 6.6% | 6.3% |
| Standard Deviation (Sample) | 6.6% | 9.1% |
| Standard Deviation (Population) | 6.5% | 9.1% |
Similar Demographics by Poverty
Demographics Similar to Immigrants from Cabo Verde by Poverty
In terms of poverty, the demographic groups most similar to Immigrants from Cabo Verde are Indonesian (15.1%, a difference of 0.050%), Immigrants from Zaire (15.1%, a difference of 0.060%), Mexican (15.1%, a difference of 0.13%), Immigrants from Belize (15.1%, a difference of 0.23%), and Yaqui (15.1%, a difference of 0.35%).
| Demographics | Rating | Rank | Poverty |
| West Indians | 0.0 /100 | #284 | Tragic 15.0% |
| Vietnamese | 0.0 /100 | #285 | Tragic 15.0% |
| Immigrants | Latin America | 0.0 /100 | #286 | Tragic 15.0% |
| Inupiat | 0.0 /100 | #287 | Tragic 15.1% |
| Yaqui | 0.0 /100 | #288 | Tragic 15.1% |
| Immigrants | Belize | 0.0 /100 | #289 | Tragic 15.1% |
| Mexicans | 0.0 /100 | #290 | Tragic 15.1% |
| Immigrants | Cabo Verde | 0.0 /100 | #291 | Tragic 15.1% |
| Indonesians | 0.0 /100 | #292 | Tragic 15.1% |
| Immigrants | Zaire | 0.0 /100 | #293 | Tragic 15.1% |
| Blackfeet | 0.0 /100 | #294 | Tragic 15.2% |
| Guatemalans | 0.0 /100 | #295 | Tragic 15.3% |
| Hispanics or Latinos | 0.0 /100 | #296 | Tragic 15.3% |
| Immigrants | Bangladesh | 0.0 /100 | #297 | Tragic 15.3% |
| Immigrants | Senegal | 0.0 /100 | #298 | Tragic 15.3% |
Demographics Similar to Central Americans by Poverty
In terms of poverty, the demographic groups most similar to Central Americans are Immigrants from Cuba (14.6%, a difference of 0.14%), Subsaharan African (14.5%, a difference of 0.29%), Iroquois (14.5%, a difference of 0.33%), Shoshone (14.7%, a difference of 0.58%), and Chickasaw (14.7%, a difference of 0.63%).
| Demographics | Rating | Rank | Poverty |
| Jamaicans | 0.1 /100 | #263 | Tragic 14.4% |
| Immigrants | Jamaica | 0.1 /100 | #264 | Tragic 14.4% |
| Immigrants | Guyana | 0.1 /100 | #265 | Tragic 14.5% |
| Guyanese | 0.1 /100 | #266 | Tragic 14.5% |
| Iroquois | 0.1 /100 | #267 | Tragic 14.5% |
| Sub-Saharan Africans | 0.1 /100 | #268 | Tragic 14.5% |
| Immigrants | Cuba | 0.1 /100 | #269 | Tragic 14.6% |
| Central Americans | 0.1 /100 | #270 | Tragic 14.6% |
| Shoshone | 0.0 /100 | #271 | Tragic 14.7% |
| Chickasaw | 0.0 /100 | #272 | Tragic 14.7% |
| Spanish Americans | 0.0 /100 | #273 | Tragic 14.7% |
| Barbadians | 0.0 /100 | #274 | Tragic 14.8% |
| Immigrants | West Indies | 0.0 /100 | #275 | Tragic 14.8% |
| Immigrants | Bahamas | 0.0 /100 | #276 | Tragic 14.8% |
| Bangladeshis | 0.0 /100 | #277 | Tragic 14.8% |