Immigrants from Turkey vs Chinese Child Poverty Among Boys Under 16
COMPARE
Immigrants from Turkey
Chinese
Child Poverty Among Boys Under 16
Child Poverty Among Boys Under 16 Comparison
Immigrants from Turkey
Chinese
14.6%
CHILD POVERTY AMONG BOYS UNDER 16
98.0/ 100
METRIC RATING
73rd/ 347
METRIC RANK
11.9%
CHILD POVERTY AMONG BOYS UNDER 16
100.0/ 100
METRIC RATING
5th/ 347
METRIC RANK
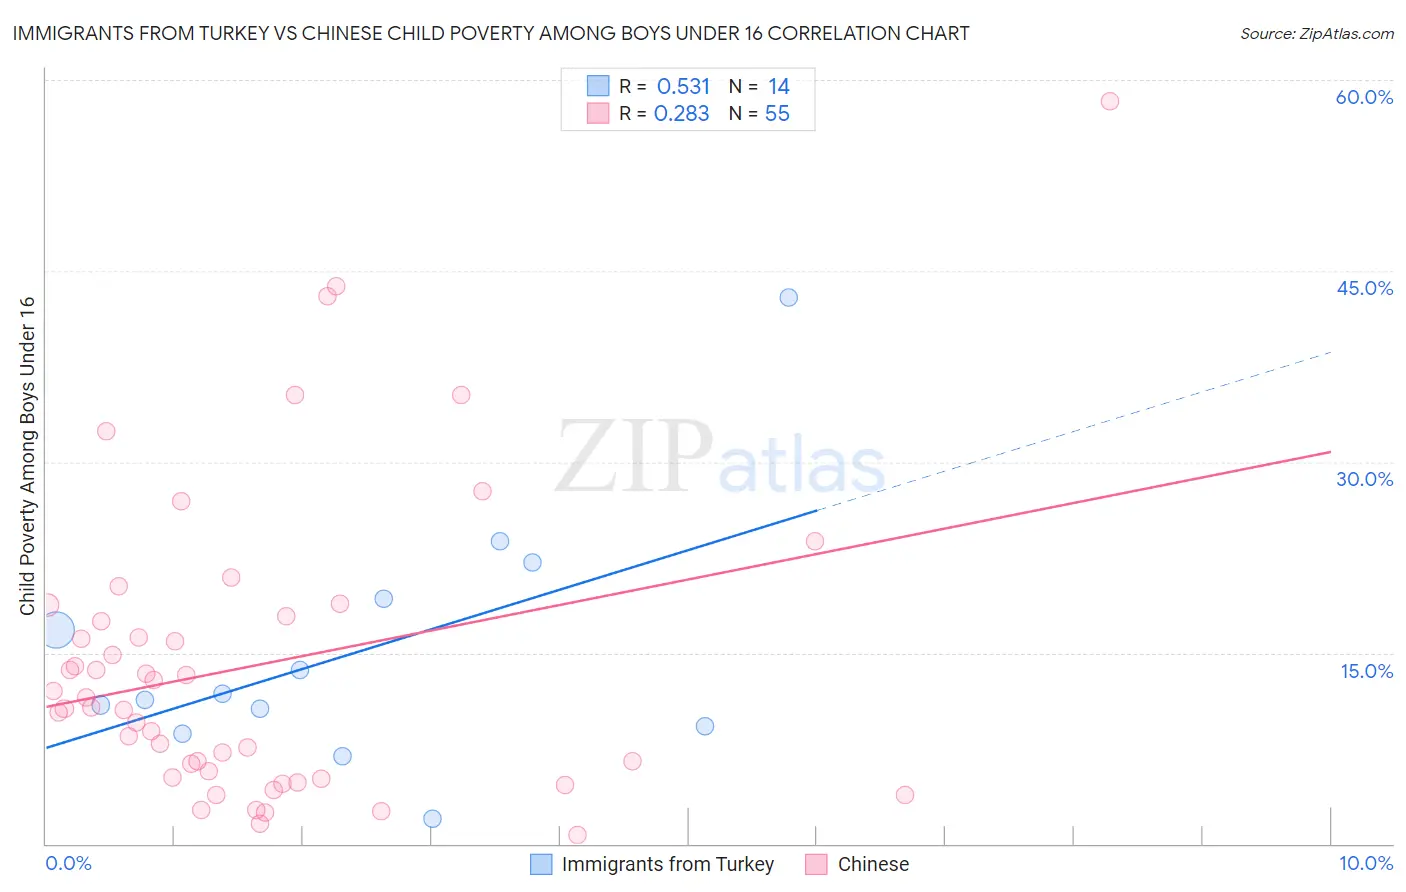
Immigrants from Turkey vs Chinese Child Poverty Among Boys Under 16 Correlation Chart
The statistical analysis conducted on geographies consisting of 220,445,013 people shows a substantial positive correlation between the proportion of Immigrants from Turkey and poverty level among boys under the age of 16 in the United States with a correlation coefficient (R) of 0.531 and weighted average of 14.6%. Similarly, the statistical analysis conducted on geographies consisting of 64,708,230 people shows a weak positive correlation between the proportion of Chinese and poverty level among boys under the age of 16 in the United States with a correlation coefficient (R) of 0.283 and weighted average of 11.9%, a difference of 23.4%.
Child Poverty Among Boys Under 16 Correlation Summary
| Measurement | Immigrants from Turkey | Chinese |
| Minimum | 1.9% | 0.70% |
| Maximum | 43.0% | 58.3% |
| Range | 41.0% | 57.6% |
| Mean | 15.0% | 14.1% |
| Median | 11.5% | 10.7% |
| Interquartile 25% (IQ1) | 9.3% | 5.2% |
| Interquartile 75% (IQ3) | 19.2% | 17.9% |
| Interquartile Range (IQR) | 10.0% | 12.7% |
| Standard Deviation (Sample) | 10.0% | 11.9% |
| Standard Deviation (Population) | 9.7% | 11.8% |
Similar Demographics by Child Poverty Among Boys Under 16
Demographics Similar to Immigrants from Turkey by Child Poverty Among Boys Under 16
In terms of child poverty among boys under 16, the demographic groups most similar to Immigrants from Turkey are Immigrants from Latvia (14.6%, a difference of 0.050%), Australian (14.7%, a difference of 0.050%), Immigrants from Netherlands (14.6%, a difference of 0.060%), Immigrants from Poland (14.7%, a difference of 0.12%), and Immigrants from Croatia (14.7%, a difference of 0.17%).
| Demographics | Rating | Rank | Child Poverty Among Boys Under 16 |
| Immigrants | Bulgaria | 98.5 /100 | #66 | Exceptional 14.5% |
| Immigrants | Europe | 98.4 /100 | #67 | Exceptional 14.5% |
| Slovenes | 98.4 /100 | #68 | Exceptional 14.5% |
| Immigrants | Austria | 98.4 /100 | #69 | Exceptional 14.5% |
| Europeans | 98.4 /100 | #70 | Exceptional 14.5% |
| Immigrants | Netherlands | 98.1 /100 | #71 | Exceptional 14.6% |
| Immigrants | Latvia | 98.1 /100 | #72 | Exceptional 14.6% |
| Immigrants | Turkey | 98.0 /100 | #73 | Exceptional 14.6% |
| Australians | 98.0 /100 | #74 | Exceptional 14.7% |
| Immigrants | Poland | 97.9 /100 | #75 | Exceptional 14.7% |
| Immigrants | Croatia | 97.9 /100 | #76 | Exceptional 14.7% |
| Macedonians | 97.9 /100 | #77 | Exceptional 14.7% |
| Egyptians | 97.8 /100 | #78 | Exceptional 14.7% |
| Immigrants | Eastern Europe | 97.8 /100 | #79 | Exceptional 14.7% |
| Immigrants | Russia | 97.7 /100 | #80 | Exceptional 14.7% |
Demographics Similar to Chinese by Child Poverty Among Boys Under 16
In terms of child poverty among boys under 16, the demographic groups most similar to Chinese are Thai (11.7%, a difference of 1.6%), Immigrants from Hong Kong (12.3%, a difference of 3.3%), Iranian (12.4%, a difference of 4.9%), Immigrants from Singapore (12.5%, a difference of 5.2%), and Immigrants from Iran (12.5%, a difference of 5.8%).
| Demographics | Rating | Rank | Child Poverty Among Boys Under 16 |
| Immigrants | India | 100.0 /100 | #1 | Exceptional 10.9% |
| Immigrants | Taiwan | 100.0 /100 | #2 | Exceptional 11.0% |
| Filipinos | 100.0 /100 | #3 | Exceptional 11.1% |
| Thais | 100.0 /100 | #4 | Exceptional 11.7% |
| Chinese | 100.0 /100 | #5 | Exceptional 11.9% |
| Immigrants | Hong Kong | 100.0 /100 | #6 | Exceptional 12.3% |
| Iranians | 100.0 /100 | #7 | Exceptional 12.4% |
| Immigrants | Singapore | 100.0 /100 | #8 | Exceptional 12.5% |
| Immigrants | Iran | 100.0 /100 | #9 | Exceptional 12.5% |
| Bhutanese | 100.0 /100 | #10 | Exceptional 12.6% |
| Immigrants | South Central Asia | 100.0 /100 | #11 | Exceptional 12.7% |
| Burmese | 99.9 /100 | #12 | Exceptional 13.0% |
| Immigrants | Korea | 99.9 /100 | #13 | Exceptional 13.0% |
| Immigrants | Ireland | 99.9 /100 | #14 | Exceptional 13.1% |
| Immigrants | Japan | 99.9 /100 | #15 | Exceptional 13.1% |