Immigrants from Turkey vs British West Indian Child Poverty Among Boys Under 16
COMPARE
Immigrants from Turkey
British West Indian
Child Poverty Among Boys Under 16
Child Poverty Among Boys Under 16 Comparison
Immigrants from Turkey
British West Indians
14.6%
CHILD POVERTY AMONG BOYS UNDER 16
98.0/ 100
METRIC RATING
73rd/ 347
METRIC RANK
21.6%
CHILD POVERTY AMONG BOYS UNDER 16
0.0/ 100
METRIC RATING
313th/ 347
METRIC RANK
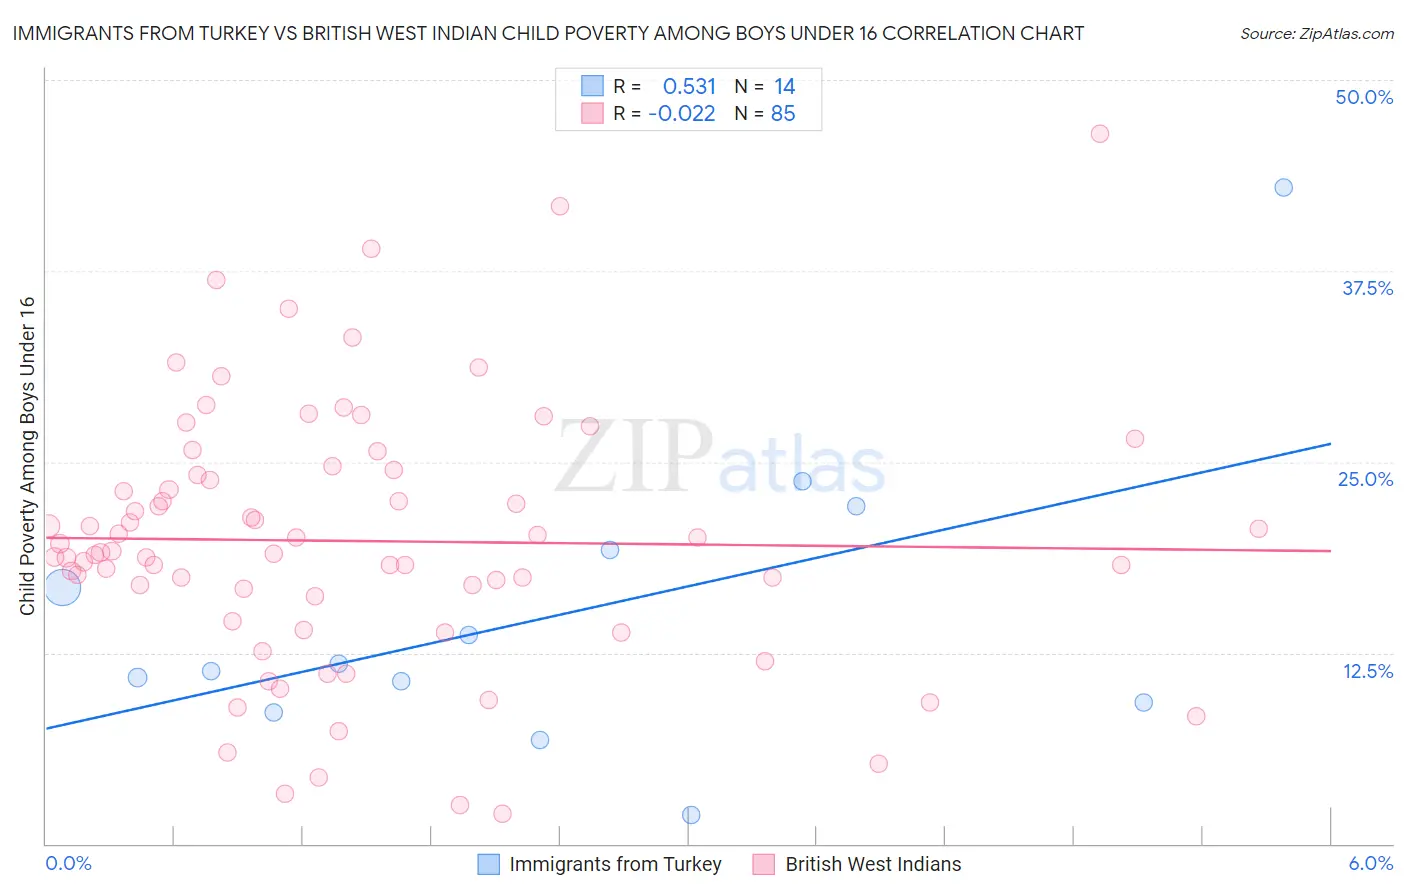
Immigrants from Turkey vs British West Indian Child Poverty Among Boys Under 16 Correlation Chart
The statistical analysis conducted on geographies consisting of 220,445,013 people shows a substantial positive correlation between the proportion of Immigrants from Turkey and poverty level among boys under the age of 16 in the United States with a correlation coefficient (R) of 0.531 and weighted average of 14.6%. Similarly, the statistical analysis conducted on geographies consisting of 151,753,314 people shows no correlation between the proportion of British West Indians and poverty level among boys under the age of 16 in the United States with a correlation coefficient (R) of -0.022 and weighted average of 21.6%, a difference of 47.4%.
Child Poverty Among Boys Under 16 Correlation Summary
| Measurement | Immigrants from Turkey | British West Indian |
| Minimum | 1.9% | 2.0% |
| Maximum | 43.0% | 46.4% |
| Range | 41.0% | 44.5% |
| Mean | 15.0% | 19.8% |
| Median | 11.5% | 19.1% |
| Interquartile 25% (IQ1) | 9.3% | 15.4% |
| Interquartile 75% (IQ3) | 19.2% | 24.3% |
| Interquartile Range (IQR) | 10.0% | 8.9% |
| Standard Deviation (Sample) | 10.0% | 8.6% |
| Standard Deviation (Population) | 9.7% | 8.5% |
Similar Demographics by Child Poverty Among Boys Under 16
Demographics Similar to Immigrants from Turkey by Child Poverty Among Boys Under 16
In terms of child poverty among boys under 16, the demographic groups most similar to Immigrants from Turkey are Immigrants from Latvia (14.6%, a difference of 0.050%), Australian (14.7%, a difference of 0.050%), Immigrants from Netherlands (14.6%, a difference of 0.060%), Immigrants from Poland (14.7%, a difference of 0.12%), and Immigrants from Croatia (14.7%, a difference of 0.17%).
| Demographics | Rating | Rank | Child Poverty Among Boys Under 16 |
| Immigrants | Bulgaria | 98.5 /100 | #66 | Exceptional 14.5% |
| Immigrants | Europe | 98.4 /100 | #67 | Exceptional 14.5% |
| Slovenes | 98.4 /100 | #68 | Exceptional 14.5% |
| Immigrants | Austria | 98.4 /100 | #69 | Exceptional 14.5% |
| Europeans | 98.4 /100 | #70 | Exceptional 14.5% |
| Immigrants | Netherlands | 98.1 /100 | #71 | Exceptional 14.6% |
| Immigrants | Latvia | 98.1 /100 | #72 | Exceptional 14.6% |
| Immigrants | Turkey | 98.0 /100 | #73 | Exceptional 14.6% |
| Australians | 98.0 /100 | #74 | Exceptional 14.7% |
| Immigrants | Poland | 97.9 /100 | #75 | Exceptional 14.7% |
| Immigrants | Croatia | 97.9 /100 | #76 | Exceptional 14.7% |
| Macedonians | 97.9 /100 | #77 | Exceptional 14.7% |
| Egyptians | 97.8 /100 | #78 | Exceptional 14.7% |
| Immigrants | Eastern Europe | 97.8 /100 | #79 | Exceptional 14.7% |
| Immigrants | Russia | 97.7 /100 | #80 | Exceptional 14.7% |
Demographics Similar to British West Indians by Child Poverty Among Boys Under 16
In terms of child poverty among boys under 16, the demographic groups most similar to British West Indians are Immigrants from Guatemala (21.6%, a difference of 0.0%), Ute (21.6%, a difference of 0.010%), Bahamian (21.6%, a difference of 0.090%), Creek (21.5%, a difference of 0.20%), and Seminole (21.5%, a difference of 0.26%).
| Demographics | Rating | Rank | Child Poverty Among Boys Under 16 |
| Immigrants | Grenada | 0.0 /100 | #306 | Tragic 21.3% |
| Choctaw | 0.0 /100 | #307 | Tragic 21.3% |
| Immigrants | Mexico | 0.0 /100 | #308 | Tragic 21.5% |
| Seminole | 0.0 /100 | #309 | Tragic 21.5% |
| Creek | 0.0 /100 | #310 | Tragic 21.5% |
| Bahamians | 0.0 /100 | #311 | Tragic 21.6% |
| Immigrants | Guatemala | 0.0 /100 | #312 | Tragic 21.6% |
| British West Indians | 0.0 /100 | #313 | Tragic 21.6% |
| Ute | 0.0 /100 | #314 | Tragic 21.6% |
| Immigrants | Somalia | 0.0 /100 | #315 | Tragic 21.7% |
| Menominee | 0.0 /100 | #316 | Tragic 21.7% |
| Africans | 0.0 /100 | #317 | Tragic 21.7% |
| Yakama | 0.0 /100 | #318 | Tragic 21.7% |
| Dutch West Indians | 0.0 /100 | #319 | Tragic 21.8% |
| U.S. Virgin Islanders | 0.0 /100 | #320 | Tragic 22.0% |