Cape Verdean vs Chinese Child Poverty Among Boys Under 16
COMPARE
Cape Verdean
Chinese
Child Poverty Among Boys Under 16
Child Poverty Among Boys Under 16 Comparison
Cape Verdeans
Chinese
18.7%
CHILD POVERTY AMONG BOYS UNDER 16
0.7/ 100
METRIC RATING
239th/ 347
METRIC RANK
11.9%
CHILD POVERTY AMONG BOYS UNDER 16
100.0/ 100
METRIC RATING
5th/ 347
METRIC RANK
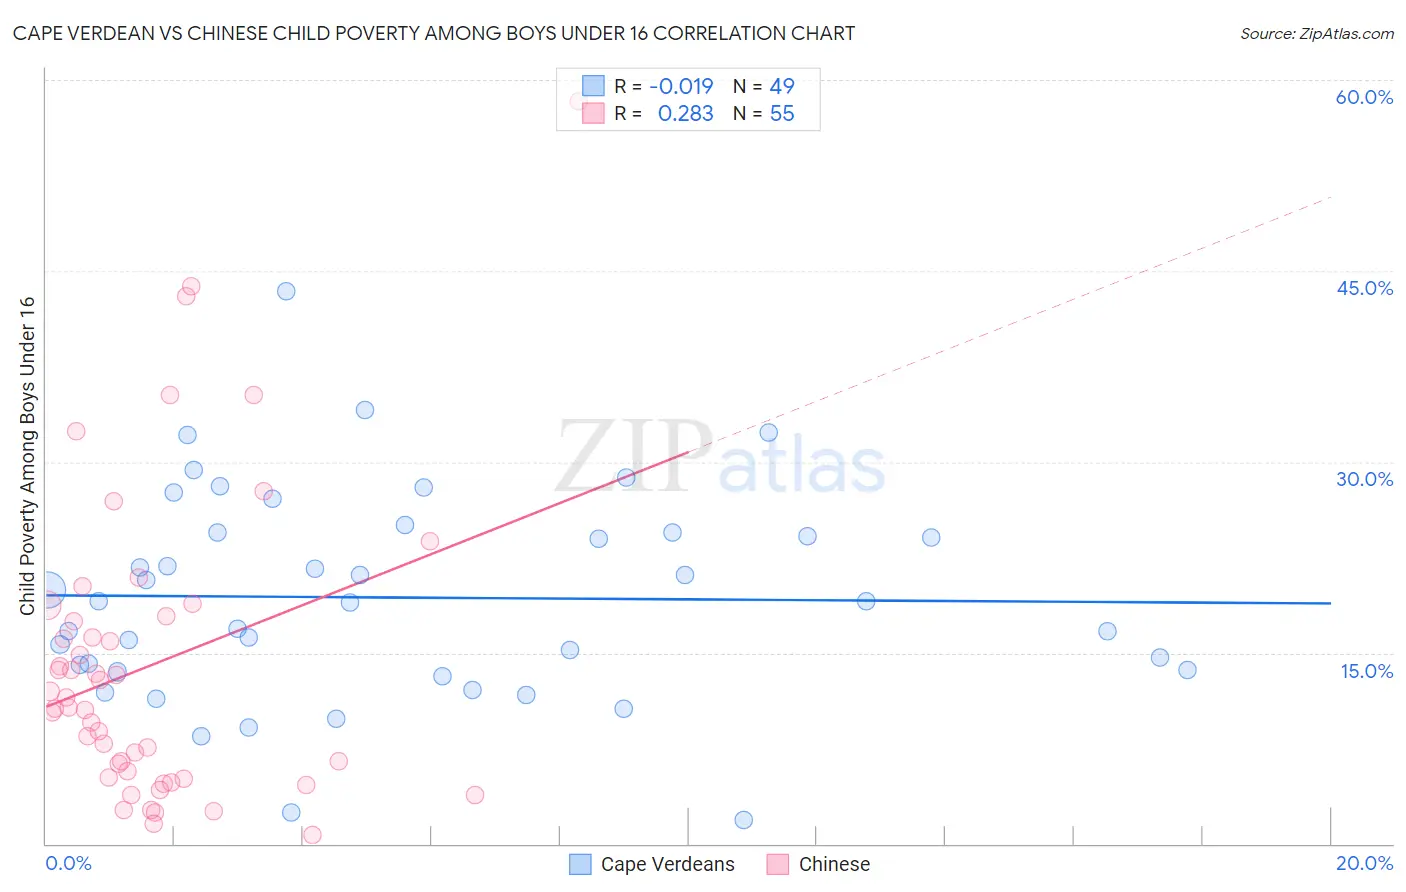
Cape Verdean vs Chinese Child Poverty Among Boys Under 16 Correlation Chart
The statistical analysis conducted on geographies consisting of 106,786,125 people shows no correlation between the proportion of Cape Verdeans and poverty level among boys under the age of 16 in the United States with a correlation coefficient (R) of -0.019 and weighted average of 18.7%. Similarly, the statistical analysis conducted on geographies consisting of 64,708,230 people shows a weak positive correlation between the proportion of Chinese and poverty level among boys under the age of 16 in the United States with a correlation coefficient (R) of 0.283 and weighted average of 11.9%, a difference of 57.7%.
Child Poverty Among Boys Under 16 Correlation Summary
| Measurement | Cape Verdean | Chinese |
| Minimum | 1.9% | 0.70% |
| Maximum | 43.4% | 58.3% |
| Range | 41.5% | 57.6% |
| Mean | 19.3% | 14.1% |
| Median | 19.1% | 10.7% |
| Interquartile 25% (IQ1) | 13.6% | 5.2% |
| Interquartile 75% (IQ3) | 24.5% | 17.9% |
| Interquartile Range (IQR) | 10.9% | 12.7% |
| Standard Deviation (Sample) | 8.2% | 11.9% |
| Standard Deviation (Population) | 8.1% | 11.8% |
Similar Demographics by Child Poverty Among Boys Under 16
Demographics Similar to Cape Verdeans by Child Poverty Among Boys Under 16
In terms of child poverty among boys under 16, the demographic groups most similar to Cape Verdeans are Immigrants from Laos (18.7%, a difference of 0.24%), Immigrants from Cuba (18.8%, a difference of 0.34%), Immigrants from Sudan (18.8%, a difference of 0.39%), Immigrants from Eritrea (18.6%, a difference of 0.45%), and Sudanese (18.6%, a difference of 0.61%).
| Demographics | Rating | Rank | Child Poverty Among Boys Under 16 |
| Marshallese | 1.3 /100 | #232 | Tragic 18.4% |
| Immigrants | Nigeria | 1.2 /100 | #233 | Tragic 18.4% |
| Nigerians | 1.1 /100 | #234 | Tragic 18.5% |
| Americans | 0.9 /100 | #235 | Tragic 18.6% |
| Sudanese | 0.9 /100 | #236 | Tragic 18.6% |
| Immigrants | Eritrea | 0.8 /100 | #237 | Tragic 18.6% |
| Immigrants | Laos | 0.8 /100 | #238 | Tragic 18.7% |
| Cape Verdeans | 0.7 /100 | #239 | Tragic 18.7% |
| Immigrants | Cuba | 0.6 /100 | #240 | Tragic 18.8% |
| Immigrants | Sudan | 0.6 /100 | #241 | Tragic 18.8% |
| Ghanaians | 0.5 /100 | #242 | Tragic 18.9% |
| Immigrants | Azores | 0.4 /100 | #243 | Tragic 18.9% |
| Immigrants | Middle Africa | 0.4 /100 | #244 | Tragic 18.9% |
| Cree | 0.4 /100 | #245 | Tragic 19.0% |
| Immigrants | Nicaragua | 0.4 /100 | #246 | Tragic 19.0% |
Demographics Similar to Chinese by Child Poverty Among Boys Under 16
In terms of child poverty among boys under 16, the demographic groups most similar to Chinese are Thai (11.7%, a difference of 1.6%), Immigrants from Hong Kong (12.3%, a difference of 3.3%), Iranian (12.4%, a difference of 4.9%), Immigrants from Singapore (12.5%, a difference of 5.2%), and Immigrants from Iran (12.5%, a difference of 5.8%).
| Demographics | Rating | Rank | Child Poverty Among Boys Under 16 |
| Immigrants | India | 100.0 /100 | #1 | Exceptional 10.9% |
| Immigrants | Taiwan | 100.0 /100 | #2 | Exceptional 11.0% |
| Filipinos | 100.0 /100 | #3 | Exceptional 11.1% |
| Thais | 100.0 /100 | #4 | Exceptional 11.7% |
| Chinese | 100.0 /100 | #5 | Exceptional 11.9% |
| Immigrants | Hong Kong | 100.0 /100 | #6 | Exceptional 12.3% |
| Iranians | 100.0 /100 | #7 | Exceptional 12.4% |
| Immigrants | Singapore | 100.0 /100 | #8 | Exceptional 12.5% |
| Immigrants | Iran | 100.0 /100 | #9 | Exceptional 12.5% |
| Bhutanese | 100.0 /100 | #10 | Exceptional 12.6% |
| Immigrants | South Central Asia | 100.0 /100 | #11 | Exceptional 12.7% |
| Burmese | 99.9 /100 | #12 | Exceptional 13.0% |
| Immigrants | Korea | 99.9 /100 | #13 | Exceptional 13.0% |
| Immigrants | Ireland | 99.9 /100 | #14 | Exceptional 13.1% |
| Immigrants | Japan | 99.9 /100 | #15 | Exceptional 13.1% |