Hungarian vs Chinese Child Poverty Among Boys Under 16
COMPARE
Hungarian
Chinese
Child Poverty Among Boys Under 16
Child Poverty Among Boys Under 16 Comparison
Hungarians
Chinese
16.5%
CHILD POVERTY AMONG BOYS UNDER 16
47.3/ 100
METRIC RATING
179th/ 347
METRIC RANK
11.9%
CHILD POVERTY AMONG BOYS UNDER 16
100.0/ 100
METRIC RATING
5th/ 347
METRIC RANK
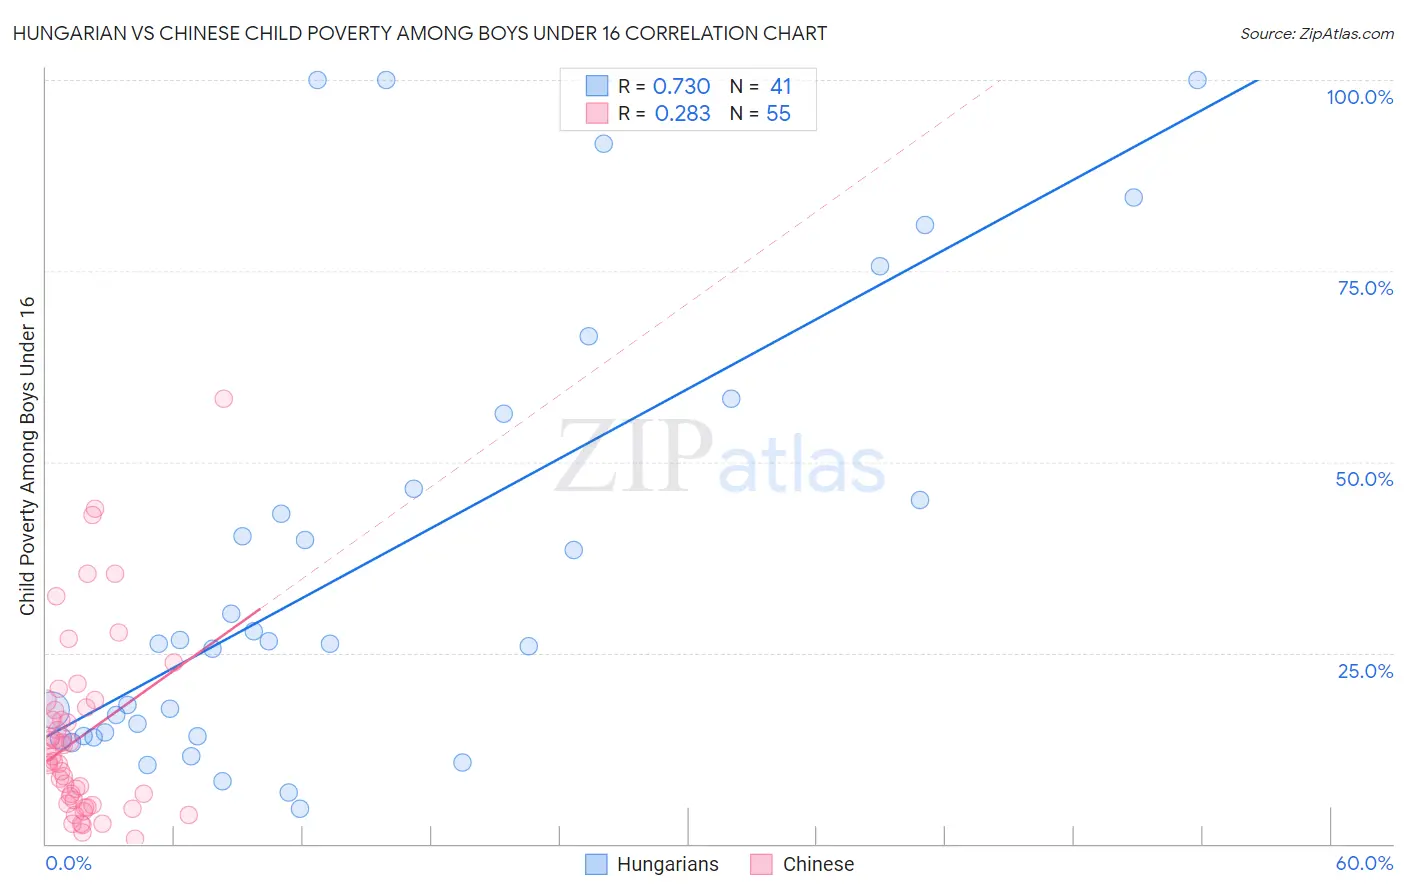
Hungarian vs Chinese Child Poverty Among Boys Under 16 Correlation Chart
The statistical analysis conducted on geographies consisting of 472,859,251 people shows a strong positive correlation between the proportion of Hungarians and poverty level among boys under the age of 16 in the United States with a correlation coefficient (R) of 0.730 and weighted average of 16.5%. Similarly, the statistical analysis conducted on geographies consisting of 64,708,230 people shows a weak positive correlation between the proportion of Chinese and poverty level among boys under the age of 16 in the United States with a correlation coefficient (R) of 0.283 and weighted average of 11.9%, a difference of 38.9%.
Child Poverty Among Boys Under 16 Correlation Summary
| Measurement | Hungarian | Chinese |
| Minimum | 4.7% | 0.70% |
| Maximum | 100.0% | 58.3% |
| Range | 95.3% | 57.6% |
| Mean | 36.7% | 14.1% |
| Median | 26.3% | 10.7% |
| Interquartile 25% (IQ1) | 14.1% | 5.2% |
| Interquartile 75% (IQ3) | 51.4% | 17.9% |
| Interquartile Range (IQR) | 37.3% | 12.7% |
| Standard Deviation (Sample) | 28.9% | 11.9% |
| Standard Deviation (Population) | 28.5% | 11.8% |
Similar Demographics by Child Poverty Among Boys Under 16
Demographics Similar to Hungarians by Child Poverty Among Boys Under 16
In terms of child poverty among boys under 16, the demographic groups most similar to Hungarians are Scotch-Irish (16.5%, a difference of 0.020%), Ethiopian (16.5%, a difference of 0.060%), White/Caucasian (16.5%, a difference of 0.10%), Immigrants from Syria (16.5%, a difference of 0.19%), and Hawaiian (16.5%, a difference of 0.20%).
| Demographics | Rating | Rank | Child Poverty Among Boys Under 16 |
| Immigrants | Colombia | 50.8 /100 | #172 | Average 16.4% |
| Tsimshian | 50.5 /100 | #173 | Average 16.4% |
| Uruguayans | 50.0 /100 | #174 | Average 16.4% |
| Immigrants | Syria | 49.0 /100 | #175 | Average 16.5% |
| Whites/Caucasians | 48.2 /100 | #176 | Average 16.5% |
| Ethiopians | 47.8 /100 | #177 | Average 16.5% |
| Scotch-Irish | 47.5 /100 | #178 | Average 16.5% |
| Hungarians | 47.3 /100 | #179 | Average 16.5% |
| Hawaiians | 45.5 /100 | #180 | Average 16.5% |
| South American Indians | 44.3 /100 | #181 | Average 16.5% |
| Lebanese | 43.3 /100 | #182 | Average 16.6% |
| Kenyans | 41.0 /100 | #183 | Average 16.6% |
| Celtics | 40.6 /100 | #184 | Average 16.6% |
| Immigrants | Western Asia | 40.4 /100 | #185 | Average 16.6% |
| Hmong | 38.4 /100 | #186 | Fair 16.6% |
Demographics Similar to Chinese by Child Poverty Among Boys Under 16
In terms of child poverty among boys under 16, the demographic groups most similar to Chinese are Thai (11.7%, a difference of 1.6%), Immigrants from Hong Kong (12.3%, a difference of 3.3%), Iranian (12.4%, a difference of 4.9%), Immigrants from Singapore (12.5%, a difference of 5.2%), and Immigrants from Iran (12.5%, a difference of 5.8%).
| Demographics | Rating | Rank | Child Poverty Among Boys Under 16 |
| Immigrants | India | 100.0 /100 | #1 | Exceptional 10.9% |
| Immigrants | Taiwan | 100.0 /100 | #2 | Exceptional 11.0% |
| Filipinos | 100.0 /100 | #3 | Exceptional 11.1% |
| Thais | 100.0 /100 | #4 | Exceptional 11.7% |
| Chinese | 100.0 /100 | #5 | Exceptional 11.9% |
| Immigrants | Hong Kong | 100.0 /100 | #6 | Exceptional 12.3% |
| Iranians | 100.0 /100 | #7 | Exceptional 12.4% |
| Immigrants | Singapore | 100.0 /100 | #8 | Exceptional 12.5% |
| Immigrants | Iran | 100.0 /100 | #9 | Exceptional 12.5% |
| Bhutanese | 100.0 /100 | #10 | Exceptional 12.6% |
| Immigrants | South Central Asia | 100.0 /100 | #11 | Exceptional 12.7% |
| Burmese | 99.9 /100 | #12 | Exceptional 13.0% |
| Immigrants | Korea | 99.9 /100 | #13 | Exceptional 13.0% |
| Immigrants | Ireland | 99.9 /100 | #14 | Exceptional 13.1% |
| Immigrants | Japan | 99.9 /100 | #15 | Exceptional 13.1% |