Immigrants from Turkey vs Crow Child Poverty Among Boys Under 16
COMPARE
Immigrants from Turkey
Crow
Child Poverty Among Boys Under 16
Child Poverty Among Boys Under 16 Comparison
Immigrants from Turkey
Crow
14.6%
CHILD POVERTY AMONG BOYS UNDER 16
98.0/ 100
METRIC RATING
73rd/ 347
METRIC RANK
26.3%
CHILD POVERTY AMONG BOYS UNDER 16
0.0/ 100
METRIC RATING
340th/ 347
METRIC RANK
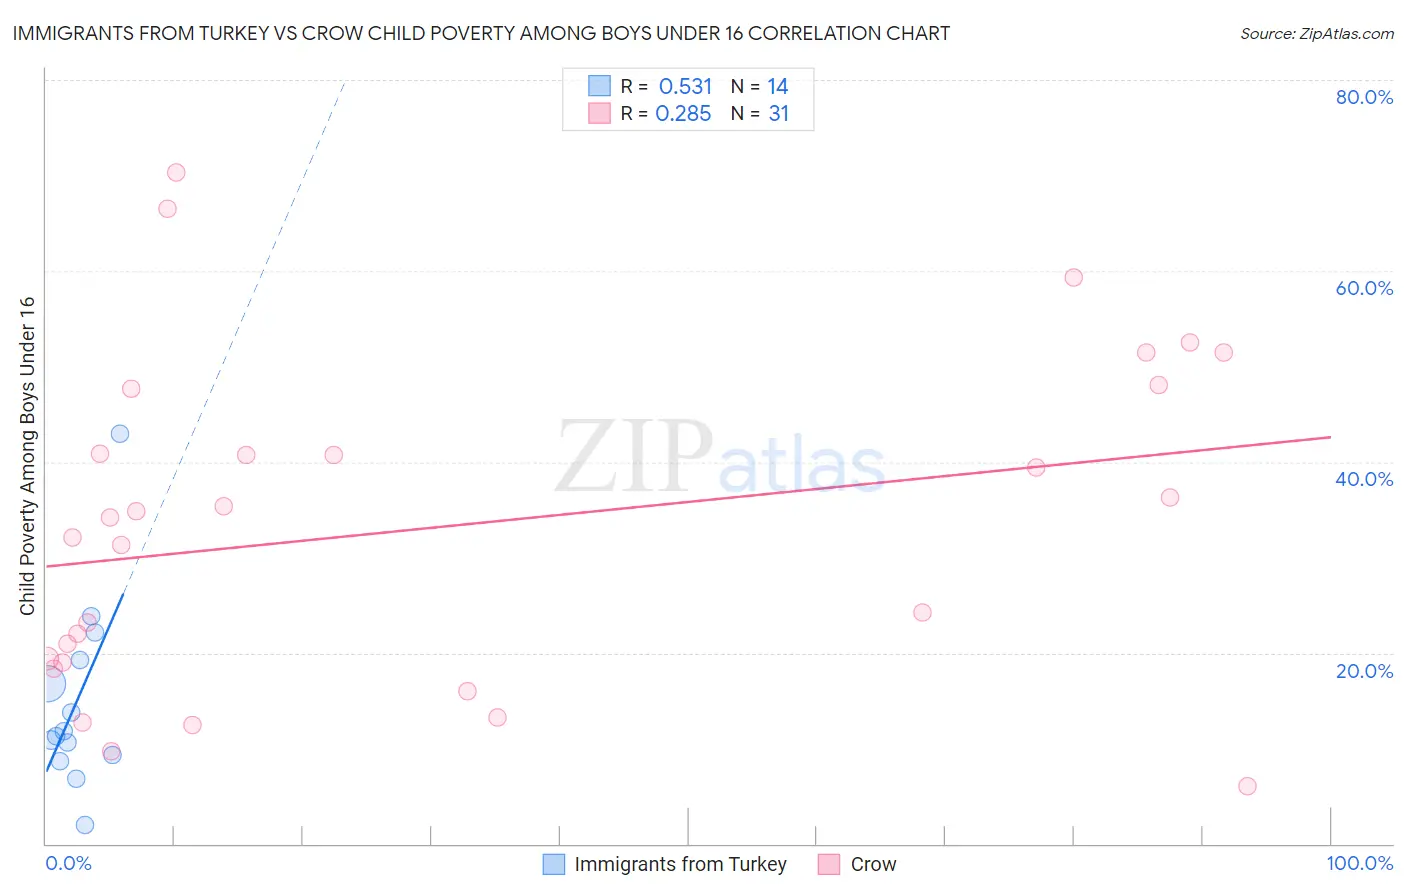
Immigrants from Turkey vs Crow Child Poverty Among Boys Under 16 Correlation Chart
The statistical analysis conducted on geographies consisting of 220,445,013 people shows a substantial positive correlation between the proportion of Immigrants from Turkey and poverty level among boys under the age of 16 in the United States with a correlation coefficient (R) of 0.531 and weighted average of 14.6%. Similarly, the statistical analysis conducted on geographies consisting of 59,088,191 people shows a weak positive correlation between the proportion of Crow and poverty level among boys under the age of 16 in the United States with a correlation coefficient (R) of 0.285 and weighted average of 26.3%, a difference of 79.3%.
Child Poverty Among Boys Under 16 Correlation Summary
| Measurement | Immigrants from Turkey | Crow |
| Minimum | 1.9% | 6.1% |
| Maximum | 43.0% | 70.3% |
| Range | 41.0% | 64.2% |
| Mean | 15.0% | 33.2% |
| Median | 11.5% | 34.2% |
| Interquartile 25% (IQ1) | 9.3% | 19.0% |
| Interquartile 75% (IQ3) | 19.2% | 47.6% |
| Interquartile Range (IQR) | 10.0% | 28.6% |
| Standard Deviation (Sample) | 10.0% | 17.1% |
| Standard Deviation (Population) | 9.7% | 16.8% |
Similar Demographics by Child Poverty Among Boys Under 16
Demographics Similar to Immigrants from Turkey by Child Poverty Among Boys Under 16
In terms of child poverty among boys under 16, the demographic groups most similar to Immigrants from Turkey are Immigrants from Latvia (14.6%, a difference of 0.050%), Australian (14.7%, a difference of 0.050%), Immigrants from Netherlands (14.6%, a difference of 0.060%), Immigrants from Poland (14.7%, a difference of 0.12%), and Immigrants from Croatia (14.7%, a difference of 0.17%).
| Demographics | Rating | Rank | Child Poverty Among Boys Under 16 |
| Immigrants | Bulgaria | 98.5 /100 | #66 | Exceptional 14.5% |
| Immigrants | Europe | 98.4 /100 | #67 | Exceptional 14.5% |
| Slovenes | 98.4 /100 | #68 | Exceptional 14.5% |
| Immigrants | Austria | 98.4 /100 | #69 | Exceptional 14.5% |
| Europeans | 98.4 /100 | #70 | Exceptional 14.5% |
| Immigrants | Netherlands | 98.1 /100 | #71 | Exceptional 14.6% |
| Immigrants | Latvia | 98.1 /100 | #72 | Exceptional 14.6% |
| Immigrants | Turkey | 98.0 /100 | #73 | Exceptional 14.6% |
| Australians | 98.0 /100 | #74 | Exceptional 14.7% |
| Immigrants | Poland | 97.9 /100 | #75 | Exceptional 14.7% |
| Immigrants | Croatia | 97.9 /100 | #76 | Exceptional 14.7% |
| Macedonians | 97.9 /100 | #77 | Exceptional 14.7% |
| Egyptians | 97.8 /100 | #78 | Exceptional 14.7% |
| Immigrants | Eastern Europe | 97.8 /100 | #79 | Exceptional 14.7% |
| Immigrants | Russia | 97.7 /100 | #80 | Exceptional 14.7% |
Demographics Similar to Crow by Child Poverty Among Boys Under 16
In terms of child poverty among boys under 16, the demographic groups most similar to Crow are Houma (26.2%, a difference of 0.16%), Hopi (25.9%, a difference of 1.2%), Cheyenne (25.8%, a difference of 1.7%), Sioux (25.3%, a difference of 3.8%), and Yup'ik (24.7%, a difference of 6.1%).
| Demographics | Rating | Rank | Child Poverty Among Boys Under 16 |
| Apache | 0.0 /100 | #333 | Tragic 24.5% |
| Blacks/African Americans | 0.0 /100 | #334 | Tragic 24.5% |
| Yup'ik | 0.0 /100 | #335 | Tragic 24.7% |
| Sioux | 0.0 /100 | #336 | Tragic 25.3% |
| Cheyenne | 0.0 /100 | #337 | Tragic 25.8% |
| Hopi | 0.0 /100 | #338 | Tragic 25.9% |
| Houma | 0.0 /100 | #339 | Tragic 26.2% |
| Crow | 0.0 /100 | #340 | Tragic 26.3% |
| Immigrants | Yemen | 0.0 /100 | #341 | Tragic 28.9% |
| Pima | 0.0 /100 | #342 | Tragic 29.7% |
| Navajo | 0.0 /100 | #343 | Tragic 30.3% |
| Yuman | 0.0 /100 | #344 | Tragic 30.6% |
| Tohono O'odham | 0.0 /100 | #345 | Tragic 31.6% |
| Lumbee | 0.0 /100 | #346 | Tragic 31.9% |
| Puerto Ricans | 0.0 /100 | #347 | Tragic 32.8% |