Immigrants from Trinidad and Tobago vs Immigrants from Sri Lanka Female Poverty
COMPARE
Immigrants from Trinidad and Tobago
Immigrants from Sri Lanka
Female Poverty
Female Poverty Comparison
Immigrants from Trinidad and Tobago
Immigrants from Sri Lanka
15.4%
FEMALE POVERTY
0.3/ 100
METRIC RATING
251st/ 347
METRIC RANK
12.1%
FEMALE POVERTY
98.5/ 100
METRIC RATING
55th/ 347
METRIC RANK
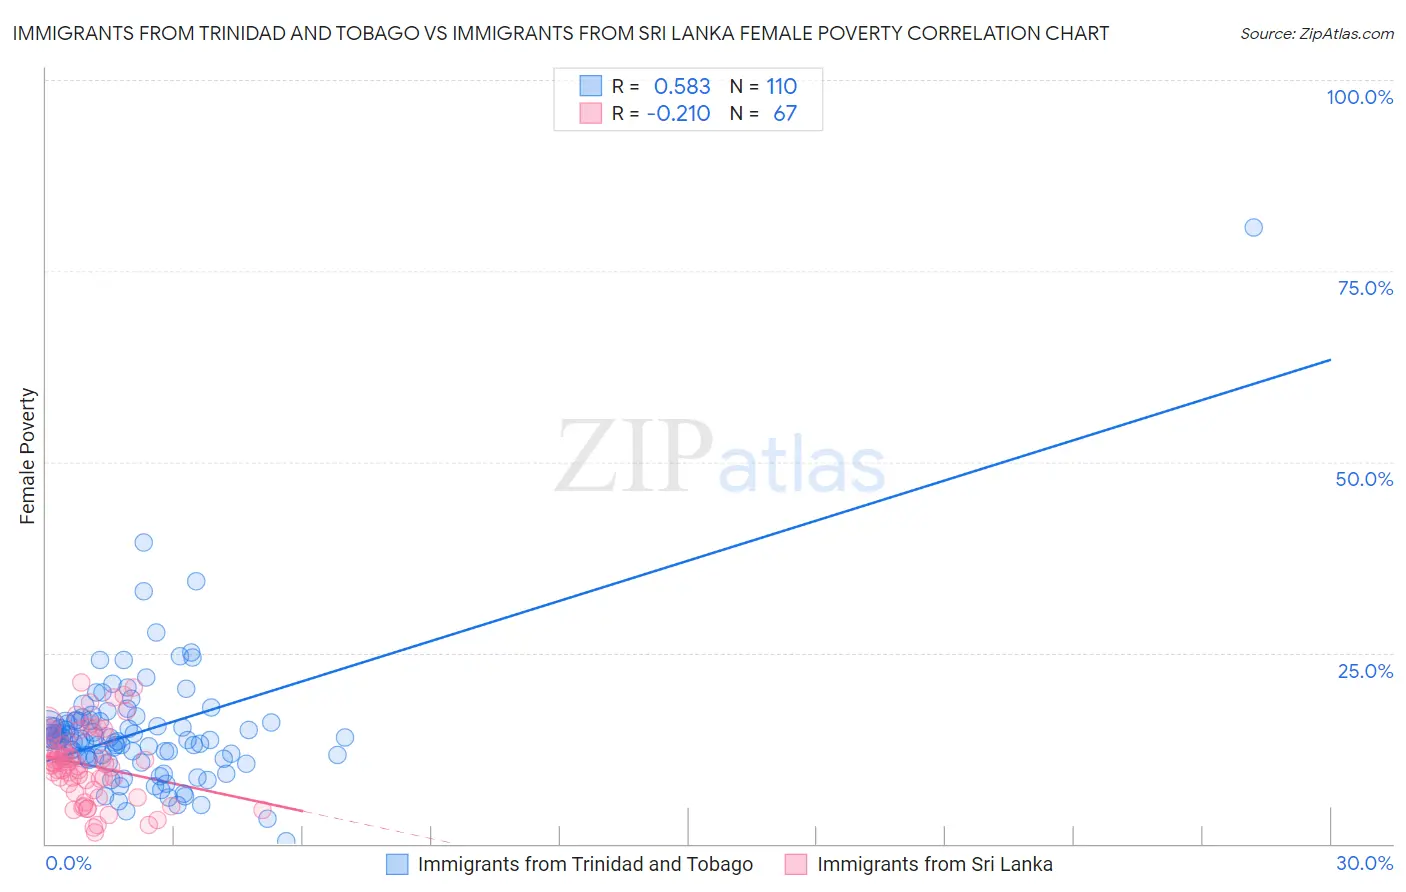
Immigrants from Trinidad and Tobago vs Immigrants from Sri Lanka Female Poverty Correlation Chart
The statistical analysis conducted on geographies consisting of 223,462,695 people shows a substantial positive correlation between the proportion of Immigrants from Trinidad and Tobago and poverty level among females in the United States with a correlation coefficient (R) of 0.583 and weighted average of 15.4%. Similarly, the statistical analysis conducted on geographies consisting of 149,673,263 people shows a weak negative correlation between the proportion of Immigrants from Sri Lanka and poverty level among females in the United States with a correlation coefficient (R) of -0.210 and weighted average of 12.1%, a difference of 27.0%.
Female Poverty Correlation Summary
| Measurement | Immigrants from Trinidad and Tobago | Immigrants from Sri Lanka |
| Minimum | 0.35% | 1.4% |
| Maximum | 80.6% | 21.1% |
| Range | 80.3% | 19.7% |
| Mean | 14.7% | 10.3% |
| Median | 13.7% | 10.3% |
| Interquartile 25% (IQ1) | 11.4% | 6.7% |
| Interquartile 75% (IQ3) | 16.1% | 13.2% |
| Interquartile Range (IQR) | 4.7% | 6.5% |
| Standard Deviation (Sample) | 8.7% | 4.7% |
| Standard Deviation (Population) | 8.7% | 4.7% |
Similar Demographics by Female Poverty
Demographics Similar to Immigrants from Trinidad and Tobago by Female Poverty
In terms of female poverty, the demographic groups most similar to Immigrants from Trinidad and Tobago are Immigrants from Burma/Myanmar (15.4%, a difference of 0.030%), Immigrants from Western Africa (15.3%, a difference of 0.16%), Salvadoran (15.3%, a difference of 0.20%), Liberian (15.4%, a difference of 0.30%), and Immigrants from Ghana (15.3%, a difference of 0.34%).
| Demographics | Rating | Rank | Female Poverty |
| Ecuadorians | 0.3 /100 | #244 | Tragic 15.3% |
| Spanish American Indians | 0.3 /100 | #245 | Tragic 15.3% |
| Cubans | 0.3 /100 | #246 | Tragic 15.3% |
| Potawatomi | 0.3 /100 | #247 | Tragic 15.3% |
| Immigrants | Ghana | 0.3 /100 | #248 | Tragic 15.3% |
| Salvadorans | 0.3 /100 | #249 | Tragic 15.3% |
| Immigrants | Western Africa | 0.3 /100 | #250 | Tragic 15.3% |
| Immigrants | Trinidad and Tobago | 0.3 /100 | #251 | Tragic 15.4% |
| Immigrants | Burma/Myanmar | 0.3 /100 | #252 | Tragic 15.4% |
| Liberians | 0.2 /100 | #253 | Tragic 15.4% |
| Trinidadians and Tobagonians | 0.2 /100 | #254 | Tragic 15.4% |
| Ottawa | 0.2 /100 | #255 | Tragic 15.5% |
| Jamaicans | 0.2 /100 | #256 | Tragic 15.5% |
| Immigrants | Jamaica | 0.1 /100 | #257 | Tragic 15.6% |
| Shoshone | 0.1 /100 | #258 | Tragic 15.6% |
Demographics Similar to Immigrants from Sri Lanka by Female Poverty
In terms of female poverty, the demographic groups most similar to Immigrants from Sri Lanka are Estonian (12.1%, a difference of 0.25%), Immigrants from Serbia (12.1%, a difference of 0.31%), Immigrants from Philippines (12.1%, a difference of 0.35%), Scandinavian (12.1%, a difference of 0.39%), and Immigrants from Europe (12.1%, a difference of 0.40%).
| Demographics | Rating | Rank | Female Poverty |
| Immigrants | Japan | 99.0 /100 | #48 | Exceptional 11.9% |
| Immigrants | Romania | 99.0 /100 | #49 | Exceptional 12.0% |
| Slovenes | 98.9 /100 | #50 | Exceptional 12.0% |
| Immigrants | Bulgaria | 98.9 /100 | #51 | Exceptional 12.0% |
| Immigrants | Croatia | 98.7 /100 | #52 | Exceptional 12.0% |
| Immigrants | Austria | 98.7 /100 | #53 | Exceptional 12.0% |
| Immigrants | Philippines | 98.7 /100 | #54 | Exceptional 12.1% |
| Immigrants | Sri Lanka | 98.5 /100 | #55 | Exceptional 12.1% |
| Estonians | 98.3 /100 | #56 | Exceptional 12.1% |
| Immigrants | Serbia | 98.3 /100 | #57 | Exceptional 12.1% |
| Scandinavians | 98.2 /100 | #58 | Exceptional 12.1% |
| Immigrants | Europe | 98.2 /100 | #59 | Exceptional 12.1% |
| Immigrants | Australia | 98.1 /100 | #60 | Exceptional 12.2% |
| Immigrants | Asia | 98.1 /100 | #61 | Exceptional 12.2% |
| Immigrants | Italy | 98.0 /100 | #62 | Exceptional 12.2% |