Immigrants from Trinidad and Tobago vs Immigrants from Lebanon Female Poverty
COMPARE
Immigrants from Trinidad and Tobago
Immigrants from Lebanon
Female Poverty
Female Poverty Comparison
Immigrants from Trinidad and Tobago
Immigrants from Lebanon
15.4%
FEMALE POVERTY
0.3/ 100
METRIC RATING
251st/ 347
METRIC RANK
13.8%
FEMALE POVERTY
25.6/ 100
METRIC RATING
199th/ 347
METRIC RANK
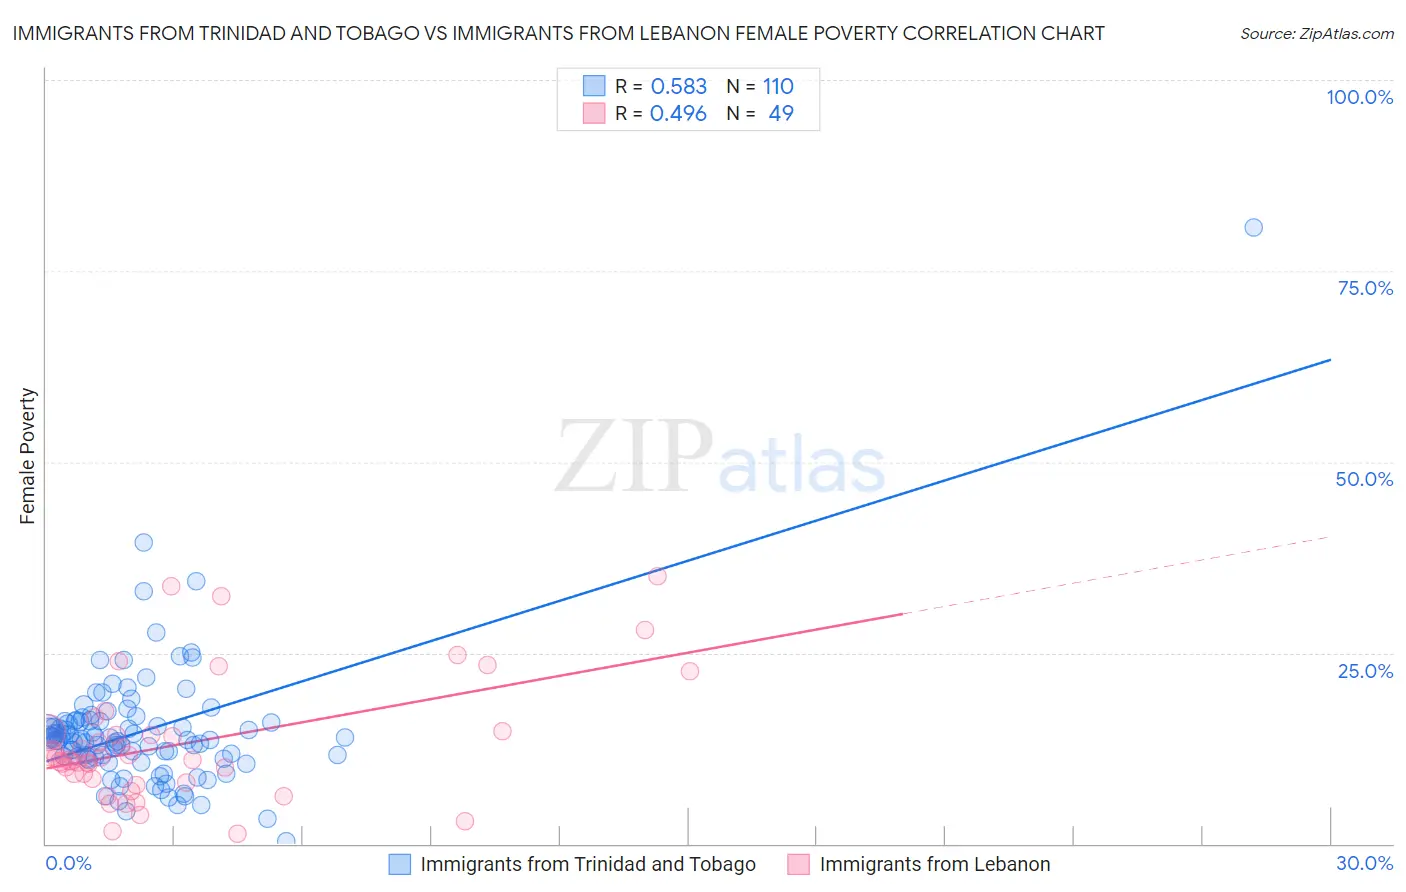
Immigrants from Trinidad and Tobago vs Immigrants from Lebanon Female Poverty Correlation Chart
The statistical analysis conducted on geographies consisting of 223,462,695 people shows a substantial positive correlation between the proportion of Immigrants from Trinidad and Tobago and poverty level among females in the United States with a correlation coefficient (R) of 0.583 and weighted average of 15.4%. Similarly, the statistical analysis conducted on geographies consisting of 217,101,802 people shows a moderate positive correlation between the proportion of Immigrants from Lebanon and poverty level among females in the United States with a correlation coefficient (R) of 0.496 and weighted average of 13.8%, a difference of 11.4%.
Female Poverty Correlation Summary
| Measurement | Immigrants from Trinidad and Tobago | Immigrants from Lebanon |
| Minimum | 0.35% | 1.4% |
| Maximum | 80.6% | 35.0% |
| Range | 80.3% | 33.6% |
| Mean | 14.7% | 13.1% |
| Median | 13.7% | 11.0% |
| Interquartile 25% (IQ1) | 11.4% | 8.2% |
| Interquartile 75% (IQ3) | 16.1% | 14.6% |
| Interquartile Range (IQR) | 4.7% | 6.4% |
| Standard Deviation (Sample) | 8.7% | 8.0% |
| Standard Deviation (Population) | 8.7% | 7.9% |
Similar Demographics by Female Poverty
Demographics Similar to Immigrants from Trinidad and Tobago by Female Poverty
In terms of female poverty, the demographic groups most similar to Immigrants from Trinidad and Tobago are Immigrants from Burma/Myanmar (15.4%, a difference of 0.030%), Immigrants from Western Africa (15.3%, a difference of 0.16%), Salvadoran (15.3%, a difference of 0.20%), Liberian (15.4%, a difference of 0.30%), and Immigrants from Ghana (15.3%, a difference of 0.34%).
| Demographics | Rating | Rank | Female Poverty |
| Ecuadorians | 0.3 /100 | #244 | Tragic 15.3% |
| Spanish American Indians | 0.3 /100 | #245 | Tragic 15.3% |
| Cubans | 0.3 /100 | #246 | Tragic 15.3% |
| Potawatomi | 0.3 /100 | #247 | Tragic 15.3% |
| Immigrants | Ghana | 0.3 /100 | #248 | Tragic 15.3% |
| Salvadorans | 0.3 /100 | #249 | Tragic 15.3% |
| Immigrants | Western Africa | 0.3 /100 | #250 | Tragic 15.3% |
| Immigrants | Trinidad and Tobago | 0.3 /100 | #251 | Tragic 15.4% |
| Immigrants | Burma/Myanmar | 0.3 /100 | #252 | Tragic 15.4% |
| Liberians | 0.2 /100 | #253 | Tragic 15.4% |
| Trinidadians and Tobagonians | 0.2 /100 | #254 | Tragic 15.4% |
| Ottawa | 0.2 /100 | #255 | Tragic 15.5% |
| Jamaicans | 0.2 /100 | #256 | Tragic 15.5% |
| Immigrants | Jamaica | 0.1 /100 | #257 | Tragic 15.6% |
| Shoshone | 0.1 /100 | #258 | Tragic 15.6% |
Demographics Similar to Immigrants from Lebanon by Female Poverty
In terms of female poverty, the demographic groups most similar to Immigrants from Lebanon are Immigrants from Uganda (13.7%, a difference of 0.34%), Arab (13.7%, a difference of 0.35%), South American Indian (13.7%, a difference of 0.39%), Spanish (13.9%, a difference of 0.55%), and Immigrants from South America (13.7%, a difference of 0.58%).
| Demographics | Rating | Rank | Female Poverty |
| Immigrants | Costa Rica | 31.9 /100 | #192 | Fair 13.7% |
| Iraqis | 31.8 /100 | #193 | Fair 13.7% |
| Delaware | 31.1 /100 | #194 | Fair 13.7% |
| Immigrants | South America | 30.6 /100 | #195 | Fair 13.7% |
| South American Indians | 28.9 /100 | #196 | Fair 13.7% |
| Arabs | 28.6 /100 | #197 | Fair 13.7% |
| Immigrants | Uganda | 28.5 /100 | #198 | Fair 13.7% |
| Immigrants | Lebanon | 25.6 /100 | #199 | Fair 13.8% |
| Spanish | 21.4 /100 | #200 | Fair 13.9% |
| Immigrants | Kenya | 21.1 /100 | #201 | Fair 13.9% |
| Hmong | 21.1 /100 | #202 | Fair 13.9% |
| Immigrants | Western Asia | 20.7 /100 | #203 | Fair 13.9% |
| Spaniards | 18.9 /100 | #204 | Poor 13.9% |
| Ugandans | 15.4 /100 | #205 | Poor 14.0% |
| Immigrants | Uruguay | 14.0 /100 | #206 | Poor 14.0% |