Immigrants from Thailand vs Immigrants from Haiti Single Male Poverty
COMPARE
Immigrants from Thailand
Immigrants from Haiti
Single Male Poverty
Single Male Poverty Comparison
Immigrants from Thailand
Immigrants from Haiti
13.0%
SINGLE MALE POVERTY
26.6/ 100
METRIC RATING
191st/ 347
METRIC RANK
13.1%
SINGLE MALE POVERTY
16.8/ 100
METRIC RATING
210th/ 347
METRIC RANK
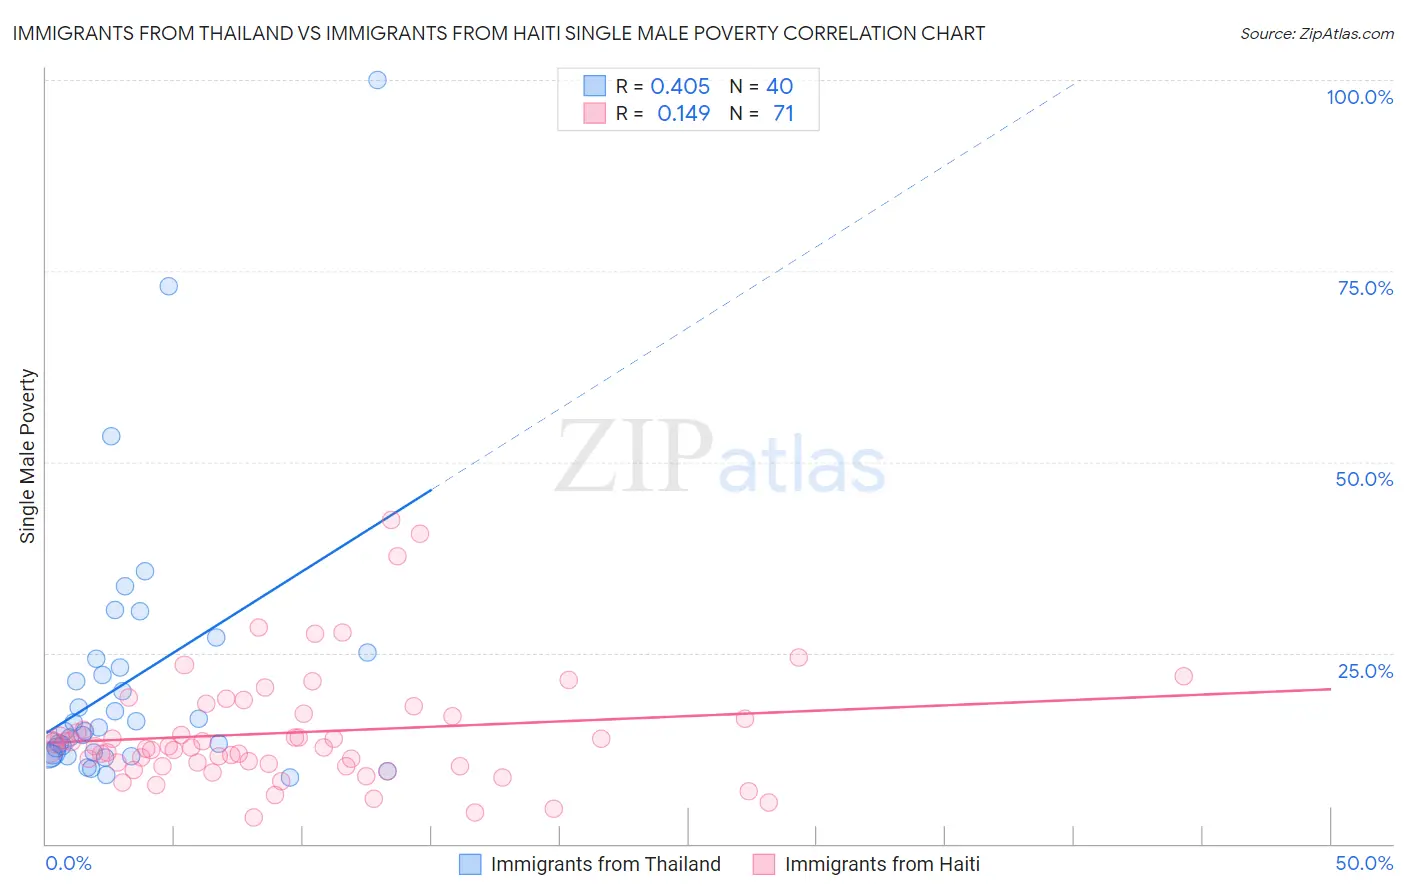
Immigrants from Thailand vs Immigrants from Haiti Single Male Poverty Correlation Chart
The statistical analysis conducted on geographies consisting of 289,372,326 people shows a moderate positive correlation between the proportion of Immigrants from Thailand and poverty level among single males in the United States with a correlation coefficient (R) of 0.405 and weighted average of 13.0%. Similarly, the statistical analysis conducted on geographies consisting of 207,631,435 people shows a poor positive correlation between the proportion of Immigrants from Haiti and poverty level among single males in the United States with a correlation coefficient (R) of 0.149 and weighted average of 13.1%, a difference of 0.75%.
Single Male Poverty Correlation Summary
| Measurement | Immigrants from Thailand | Immigrants from Haiti |
| Minimum | 8.7% | 3.4% |
| Maximum | 100.0% | 42.4% |
| Range | 91.3% | 39.0% |
| Mean | 21.4% | 14.6% |
| Median | 15.0% | 12.7% |
| Interquartile 25% (IQ1) | 11.8% | 10.2% |
| Interquartile 75% (IQ3) | 23.6% | 17.0% |
| Interquartile Range (IQR) | 11.8% | 6.8% |
| Standard Deviation (Sample) | 17.9% | 7.7% |
| Standard Deviation (Population) | 17.7% | 7.6% |
Demographics Similar to Immigrants from Thailand and Immigrants from Haiti by Single Male Poverty
In terms of single male poverty, the demographic groups most similar to Immigrants from Thailand are Immigrants from Jamaica (13.0%, a difference of 0.010%), Arab (13.0%, a difference of 0.030%), Immigrants from South Africa (13.0%, a difference of 0.030%), Liberian (13.0%, a difference of 0.090%), and Immigrants from England (13.0%, a difference of 0.22%). Similarly, the demographic groups most similar to Immigrants from Haiti are Mexican American Indian (13.1%, a difference of 0.060%), Immigrants from Western Africa (13.1%, a difference of 0.070%), Sudanese (13.1%, a difference of 0.080%), Northern European (13.0%, a difference of 0.18%), and Polish (13.0%, a difference of 0.21%).
| Demographics | Rating | Rank | Single Male Poverty |
| Arabs | 27.0 /100 | #190 | Fair 13.0% |
| Immigrants | Thailand | 26.6 /100 | #191 | Fair 13.0% |
| Immigrants | Jamaica | 26.5 /100 | #192 | Fair 13.0% |
| Immigrants | South Africa | 26.1 /100 | #193 | Fair 13.0% |
| Liberians | 25.2 /100 | #194 | Fair 13.0% |
| Immigrants | England | 23.4 /100 | #195 | Fair 13.0% |
| Immigrants | Grenada | 23.1 /100 | #196 | Fair 13.0% |
| Immigrants | Laos | 23.1 /100 | #197 | Fair 13.0% |
| Lithuanians | 22.1 /100 | #198 | Fair 13.0% |
| Immigrants | Norway | 21.8 /100 | #199 | Fair 13.0% |
| Slovenes | 21.6 /100 | #200 | Fair 13.0% |
| Trinidadians and Tobagonians | 21.4 /100 | #201 | Fair 13.0% |
| Basques | 20.7 /100 | #202 | Fair 13.0% |
| Immigrants | Bangladesh | 20.4 /100 | #203 | Fair 13.0% |
| Estonians | 20.3 /100 | #204 | Fair 13.0% |
| Poles | 19.3 /100 | #205 | Poor 13.0% |
| Northern Europeans | 18.9 /100 | #206 | Poor 13.0% |
| Sudanese | 17.7 /100 | #207 | Poor 13.1% |
| Immigrants | Western Africa | 17.6 /100 | #208 | Poor 13.1% |
| Mexican American Indians | 17.5 /100 | #209 | Poor 13.1% |
| Immigrants | Haiti | 16.8 /100 | #210 | Poor 13.1% |