Immigrants from Thailand vs Comanche Single Male Poverty
COMPARE
Immigrants from Thailand
Comanche
Single Male Poverty
Single Male Poverty Comparison
Immigrants from Thailand
Comanche
13.0%
SINGLE MALE POVERTY
26.6/ 100
METRIC RATING
191st/ 347
METRIC RANK
16.0%
SINGLE MALE POVERTY
0.0/ 100
METRIC RATING
312th/ 347
METRIC RANK
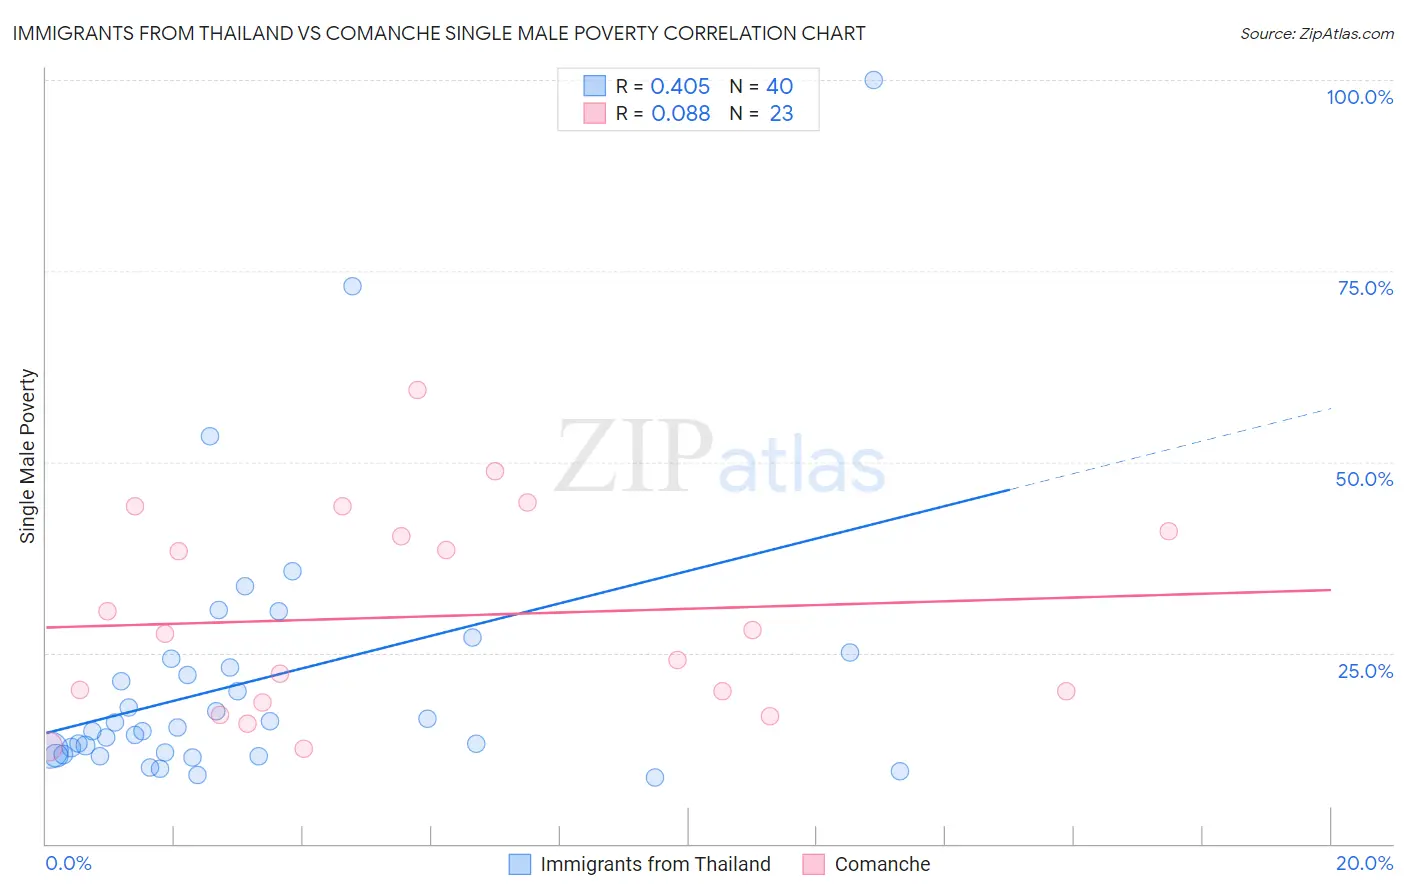
Immigrants from Thailand vs Comanche Single Male Poverty Correlation Chart
The statistical analysis conducted on geographies consisting of 289,372,326 people shows a moderate positive correlation between the proportion of Immigrants from Thailand and poverty level among single males in the United States with a correlation coefficient (R) of 0.405 and weighted average of 13.0%. Similarly, the statistical analysis conducted on geographies consisting of 105,456,343 people shows a slight positive correlation between the proportion of Comanche and poverty level among single males in the United States with a correlation coefficient (R) of 0.088 and weighted average of 16.0%, a difference of 23.5%.
Single Male Poverty Correlation Summary
| Measurement | Immigrants from Thailand | Comanche |
| Minimum | 8.7% | 12.5% |
| Maximum | 100.0% | 59.4% |
| Range | 91.3% | 46.9% |
| Mean | 21.4% | 29.8% |
| Median | 15.0% | 27.4% |
| Interquartile 25% (IQ1) | 11.8% | 18.6% |
| Interquartile 75% (IQ3) | 23.6% | 40.9% |
| Interquartile Range (IQR) | 11.8% | 22.4% |
| Standard Deviation (Sample) | 17.9% | 13.3% |
| Standard Deviation (Population) | 17.7% | 13.0% |
Similar Demographics by Single Male Poverty
Demographics Similar to Immigrants from Thailand by Single Male Poverty
In terms of single male poverty, the demographic groups most similar to Immigrants from Thailand are Immigrants from Jamaica (13.0%, a difference of 0.010%), Arab (13.0%, a difference of 0.030%), Immigrants from South Africa (13.0%, a difference of 0.030%), Liberian (13.0%, a difference of 0.090%), and Immigrants from England (13.0%, a difference of 0.22%).
| Demographics | Rating | Rank | Single Male Poverty |
| Immigrants | Trinidad and Tobago | 32.5 /100 | #184 | Fair 12.9% |
| Norwegians | 32.0 /100 | #185 | Fair 12.9% |
| Nigerians | 31.9 /100 | #186 | Fair 12.9% |
| Immigrants | Kuwait | 31.9 /100 | #187 | Fair 12.9% |
| Macedonians | 31.5 /100 | #188 | Fair 12.9% |
| Portuguese | 30.2 /100 | #189 | Fair 12.9% |
| Arabs | 27.0 /100 | #190 | Fair 13.0% |
| Immigrants | Thailand | 26.6 /100 | #191 | Fair 13.0% |
| Immigrants | Jamaica | 26.5 /100 | #192 | Fair 13.0% |
| Immigrants | South Africa | 26.1 /100 | #193 | Fair 13.0% |
| Liberians | 25.2 /100 | #194 | Fair 13.0% |
| Immigrants | England | 23.4 /100 | #195 | Fair 13.0% |
| Immigrants | Grenada | 23.1 /100 | #196 | Fair 13.0% |
| Immigrants | Laos | 23.1 /100 | #197 | Fair 13.0% |
| Lithuanians | 22.1 /100 | #198 | Fair 13.0% |
Demographics Similar to Comanche by Single Male Poverty
In terms of single male poverty, the demographic groups most similar to Comanche are Seminole (16.0%, a difference of 0.0%), Cherokee (16.1%, a difference of 0.23%), Alaskan Athabascan (16.1%, a difference of 0.52%), Yakama (15.9%, a difference of 0.54%), and Cheyenne (16.1%, a difference of 0.56%).
| Demographics | Rating | Rank | Single Male Poverty |
| Blackfeet | 0.0 /100 | #305 | Tragic 15.5% |
| Pennsylvania Germans | 0.0 /100 | #306 | Tragic 15.6% |
| Ute | 0.0 /100 | #307 | Tragic 15.7% |
| Potawatomi | 0.0 /100 | #308 | Tragic 15.8% |
| Americans | 0.0 /100 | #309 | Tragic 15.8% |
| Yakama | 0.0 /100 | #310 | Tragic 15.9% |
| Seminole | 0.0 /100 | #311 | Tragic 16.0% |
| Comanche | 0.0 /100 | #312 | Tragic 16.0% |
| Cherokee | 0.0 /100 | #313 | Tragic 16.1% |
| Alaskan Athabascans | 0.0 /100 | #314 | Tragic 16.1% |
| Cheyenne | 0.0 /100 | #315 | Tragic 16.1% |
| Dutch West Indians | 0.0 /100 | #316 | Tragic 16.1% |
| Blacks/African Americans | 0.0 /100 | #317 | Tragic 16.2% |
| Chickasaw | 0.0 /100 | #318 | Tragic 16.3% |
| Chippewa | 0.0 /100 | #319 | Tragic 16.4% |