Immigrants from Sweden vs Arapaho Poverty
COMPARE
Immigrants from Sweden
Arapaho
Poverty
Poverty Comparison
Immigrants from Sweden
Arapaho
11.3%
POVERTY
96.3/ 100
METRIC RATING
83rd/ 347
METRIC RANK
16.3%
POVERTY
0.0/ 100
METRIC RATING
321st/ 347
METRIC RANK
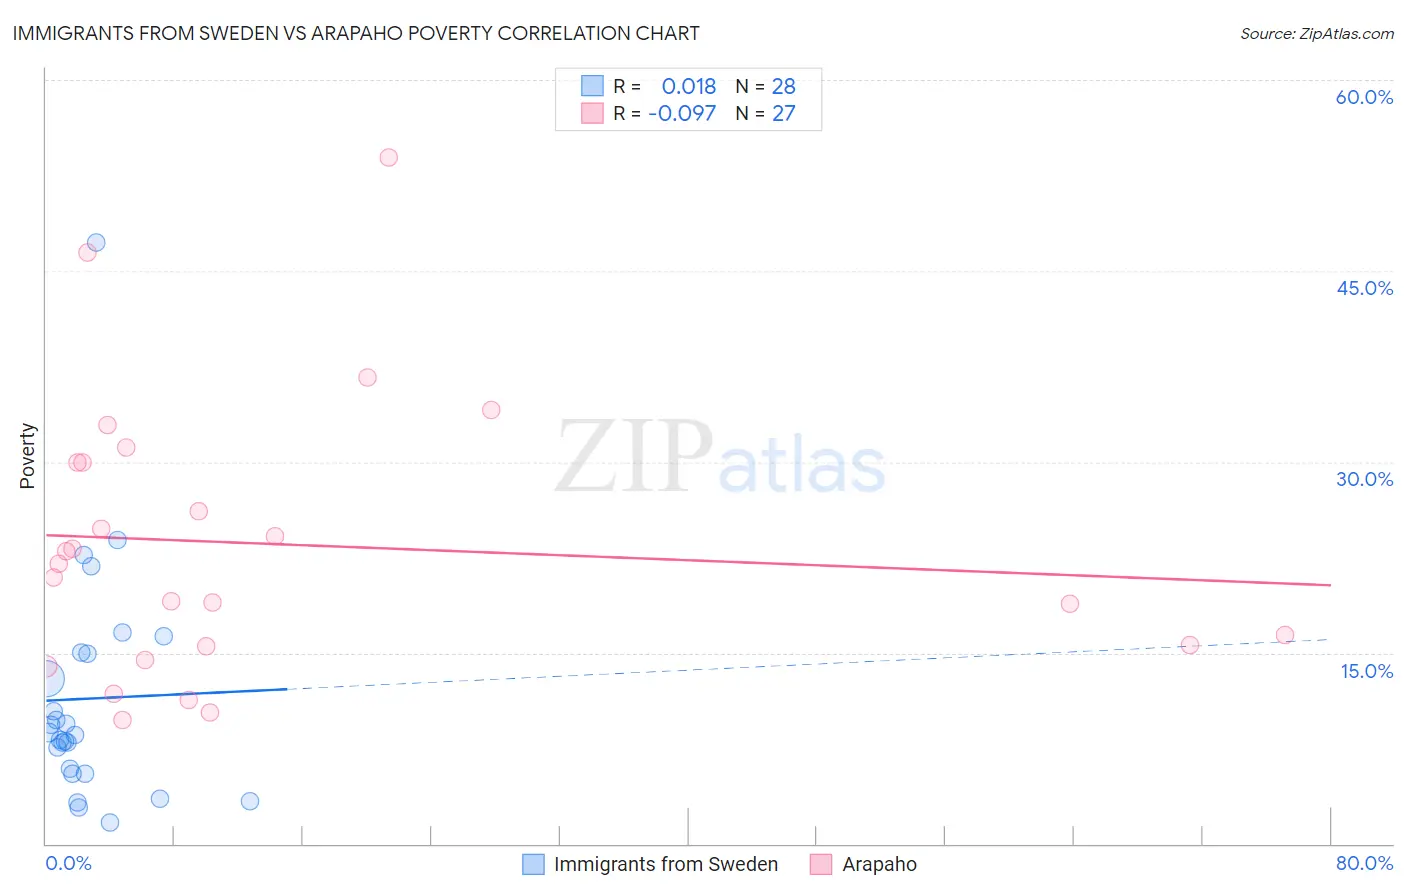
Immigrants from Sweden vs Arapaho Poverty Correlation Chart
The statistical analysis conducted on geographies consisting of 164,694,810 people shows no correlation between the proportion of Immigrants from Sweden and poverty level in the United States with a correlation coefficient (R) of 0.018 and weighted average of 11.3%. Similarly, the statistical analysis conducted on geographies consisting of 29,778,572 people shows a slight negative correlation between the proportion of Arapaho and poverty level in the United States with a correlation coefficient (R) of -0.097 and weighted average of 16.3%, a difference of 43.5%.
Poverty Correlation Summary
| Measurement | Immigrants from Sweden | Arapaho |
| Minimum | 1.7% | 9.8% |
| Maximum | 47.2% | 53.9% |
| Range | 45.6% | 44.2% |
| Mean | 11.4% | 23.5% |
| Median | 8.7% | 22.0% |
| Interquartile 25% (IQ1) | 5.7% | 15.5% |
| Interquartile 75% (IQ3) | 15.0% | 30.0% |
| Interquartile Range (IQR) | 9.3% | 14.4% |
| Standard Deviation (Sample) | 9.2% | 10.8% |
| Standard Deviation (Population) | 9.1% | 10.6% |
Similar Demographics by Poverty
Demographics Similar to Immigrants from Sweden by Poverty
In terms of poverty, the demographic groups most similar to Immigrants from Sweden are English (11.3%, a difference of 0.010%), Immigrants from England (11.4%, a difference of 0.080%), Egyptian (11.3%, a difference of 0.18%), Jordanian (11.4%, a difference of 0.19%), and Northern European (11.4%, a difference of 0.20%).
| Demographics | Rating | Rank | Poverty |
| Immigrants | North America | 96.8 /100 | #76 | Exceptional 11.3% |
| Immigrants | Eastern Asia | 96.7 /100 | #77 | Exceptional 11.3% |
| Dutch | 96.7 /100 | #78 | Exceptional 11.3% |
| Cambodians | 96.7 /100 | #79 | Exceptional 11.3% |
| Indians (Asian) | 96.6 /100 | #80 | Exceptional 11.3% |
| Irish | 96.6 /100 | #81 | Exceptional 11.3% |
| Egyptians | 96.5 /100 | #82 | Exceptional 11.3% |
| Immigrants | Sweden | 96.3 /100 | #83 | Exceptional 11.3% |
| English | 96.3 /100 | #84 | Exceptional 11.3% |
| Immigrants | England | 96.2 /100 | #85 | Exceptional 11.4% |
| Jordanians | 96.0 /100 | #86 | Exceptional 11.4% |
| Northern Europeans | 96.0 /100 | #87 | Exceptional 11.4% |
| Belgians | 95.8 /100 | #88 | Exceptional 11.4% |
| Czechoslovakians | 95.7 /100 | #89 | Exceptional 11.4% |
| Immigrants | Denmark | 95.5 /100 | #90 | Exceptional 11.4% |
Demographics Similar to Arapaho by Poverty
In terms of poverty, the demographic groups most similar to Arapaho are Immigrants from Honduras (16.2%, a difference of 0.74%), Menominee (16.4%, a difference of 0.96%), Immigrants from Congo (16.1%, a difference of 0.97%), Immigrants from Dominica (16.1%, a difference of 1.2%), and U.S. Virgin Islander (16.1%, a difference of 1.5%).
| Demographics | Rating | Rank | Poverty |
| Immigrants | Somalia | 0.0 /100 | #314 | Tragic 15.8% |
| British West Indians | 0.0 /100 | #315 | Tragic 15.9% |
| Hondurans | 0.0 /100 | #316 | Tragic 15.9% |
| U.S. Virgin Islanders | 0.0 /100 | #317 | Tragic 16.1% |
| Immigrants | Dominica | 0.0 /100 | #318 | Tragic 16.1% |
| Immigrants | Congo | 0.0 /100 | #319 | Tragic 16.1% |
| Immigrants | Honduras | 0.0 /100 | #320 | Tragic 16.2% |
| Arapaho | 0.0 /100 | #321 | Tragic 16.3% |
| Menominee | 0.0 /100 | #322 | Tragic 16.4% |
| Colville | 0.0 /100 | #323 | Tragic 16.6% |
| Yakama | 0.0 /100 | #324 | Tragic 16.7% |
| Central American Indians | 0.0 /100 | #325 | Tragic 16.7% |
| Paiute | 0.0 /100 | #326 | Tragic 16.7% |
| Kiowa | 0.0 /100 | #327 | Tragic 16.8% |
| Ute | 0.0 /100 | #328 | Tragic 16.9% |