Immigrants from Sweden vs Trinidadian and Tobagonian 7th Grade
COMPARE
Immigrants from Sweden
Trinidadian and Tobagonian
7th Grade
7th Grade Comparison
Immigrants from Sweden
Trinidadians and Tobagonians
96.7%
7TH GRADE
98.7/ 100
METRIC RATING
98th/ 347
METRIC RANK
95.2%
7TH GRADE
0.3/ 100
METRIC RATING
269th/ 347
METRIC RANK
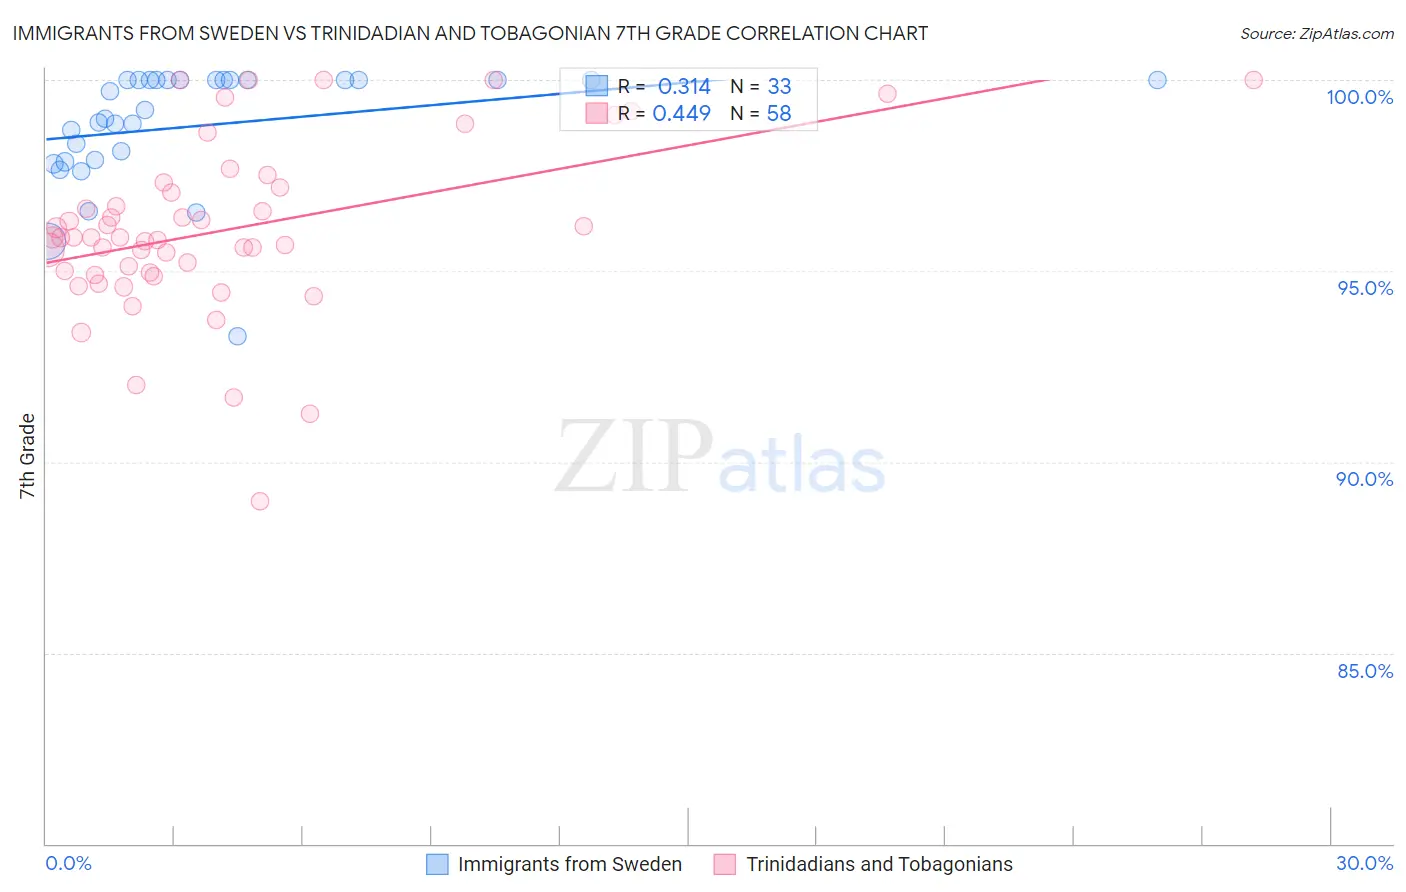
Immigrants from Sweden vs Trinidadian and Tobagonian 7th Grade Correlation Chart
The statistical analysis conducted on geographies consisting of 164,737,275 people shows a mild positive correlation between the proportion of Immigrants from Sweden and percentage of population with at least 7th grade education in the United States with a correlation coefficient (R) of 0.314 and weighted average of 96.7%. Similarly, the statistical analysis conducted on geographies consisting of 219,881,170 people shows a moderate positive correlation between the proportion of Trinidadians and Tobagonians and percentage of population with at least 7th grade education in the United States with a correlation coefficient (R) of 0.449 and weighted average of 95.2%, a difference of 1.6%.
7th Grade Correlation Summary
| Measurement | Immigrants from Sweden | Trinidadian and Tobagonian |
| Minimum | 93.3% | 89.0% |
| Maximum | 100.0% | 100.0% |
| Range | 6.7% | 11.0% |
| Mean | 98.8% | 96.1% |
| Median | 99.2% | 95.9% |
| Interquartile 25% (IQ1) | 97.9% | 95.0% |
| Interquartile 75% (IQ3) | 100.0% | 97.2% |
| Interquartile Range (IQR) | 2.1% | 2.2% |
| Standard Deviation (Sample) | 1.6% | 2.3% |
| Standard Deviation (Population) | 1.5% | 2.2% |
Similar Demographics by 7th Grade
Demographics Similar to Immigrants from Sweden by 7th Grade
In terms of 7th grade, the demographic groups most similar to Immigrants from Sweden are Immigrants from Denmark (96.7%, a difference of 0.0%), Immigrants from Germany (96.7%, a difference of 0.0%), Menominee (96.7%, a difference of 0.0%), Immigrants from Australia (96.7%, a difference of 0.010%), and German Russian (96.7%, a difference of 0.010%).
| Demographics | Rating | Rank | 7th Grade |
| Osage | 98.9 /100 | #91 | Exceptional 96.7% |
| Immigrants | Western Europe | 98.9 /100 | #92 | Exceptional 96.7% |
| Potawatomi | 98.9 /100 | #93 | Exceptional 96.7% |
| Lebanese | 98.8 /100 | #94 | Exceptional 96.7% |
| Immigrants | Australia | 98.8 /100 | #95 | Exceptional 96.7% |
| Immigrants | Denmark | 98.7 /100 | #96 | Exceptional 96.7% |
| Immigrants | Germany | 98.7 /100 | #97 | Exceptional 96.7% |
| Immigrants | Sweden | 98.7 /100 | #98 | Exceptional 96.7% |
| Menominee | 98.7 /100 | #99 | Exceptional 96.7% |
| German Russians | 98.6 /100 | #100 | Exceptional 96.7% |
| Thais | 98.6 /100 | #101 | Exceptional 96.7% |
| Immigrants | Czechoslovakia | 98.3 /100 | #102 | Exceptional 96.6% |
| Immigrants | Singapore | 98.3 /100 | #103 | Exceptional 96.6% |
| Shoshone | 98.1 /100 | #104 | Exceptional 96.6% |
| South Africans | 98.0 /100 | #105 | Exceptional 96.6% |
Demographics Similar to Trinidadians and Tobagonians by 7th Grade
In terms of 7th grade, the demographic groups most similar to Trinidadians and Tobagonians are Immigrants from Hong Kong (95.2%, a difference of 0.020%), Houma (95.1%, a difference of 0.020%), Immigrants from South America (95.1%, a difference of 0.020%), Peruvian (95.1%, a difference of 0.020%), and Immigrants from Uzbekistan (95.1%, a difference of 0.020%).
| Demographics | Rating | Rank | 7th Grade |
| Immigrants | Somalia | 0.5 /100 | #262 | Tragic 95.2% |
| West Indians | 0.5 /100 | #263 | Tragic 95.2% |
| Immigrants | Nigeria | 0.4 /100 | #264 | Tragic 95.2% |
| Immigrants | Uruguay | 0.3 /100 | #265 | Tragic 95.2% |
| Immigrants | Ghana | 0.3 /100 | #266 | Tragic 95.2% |
| Yuman | 0.3 /100 | #267 | Tragic 95.2% |
| Immigrants | Hong Kong | 0.3 /100 | #268 | Tragic 95.2% |
| Trinidadians and Tobagonians | 0.3 /100 | #269 | Tragic 95.2% |
| Houma | 0.2 /100 | #270 | Tragic 95.1% |
| Immigrants | South America | 0.2 /100 | #271 | Tragic 95.1% |
| Peruvians | 0.2 /100 | #272 | Tragic 95.1% |
| Immigrants | Uzbekistan | 0.2 /100 | #273 | Tragic 95.1% |
| Immigrants | Western Africa | 0.2 /100 | #274 | Tragic 95.1% |
| Immigrants | Colombia | 0.2 /100 | #275 | Tragic 95.1% |
| Immigrants | Thailand | 0.2 /100 | #276 | Tragic 95.1% |