Immigrants from Sweden vs Trinidadian and Tobagonian Unemployment Among Ages 45 to 54 years
COMPARE
Immigrants from Sweden
Trinidadian and Tobagonian
Unemployment Among Ages 45 to 54 years
Unemployment Among Ages 45 to 54 years Comparison
Immigrants from Sweden
Trinidadians and Tobagonians
4.4%
UNEMPLOYMENT AMONG AGES 45 TO 54 YEARS
93.0/ 100
METRIC RATING
104th/ 347
METRIC RANK
5.2%
UNEMPLOYMENT AMONG AGES 45 TO 54 YEARS
0.0/ 100
METRIC RATING
292nd/ 347
METRIC RANK
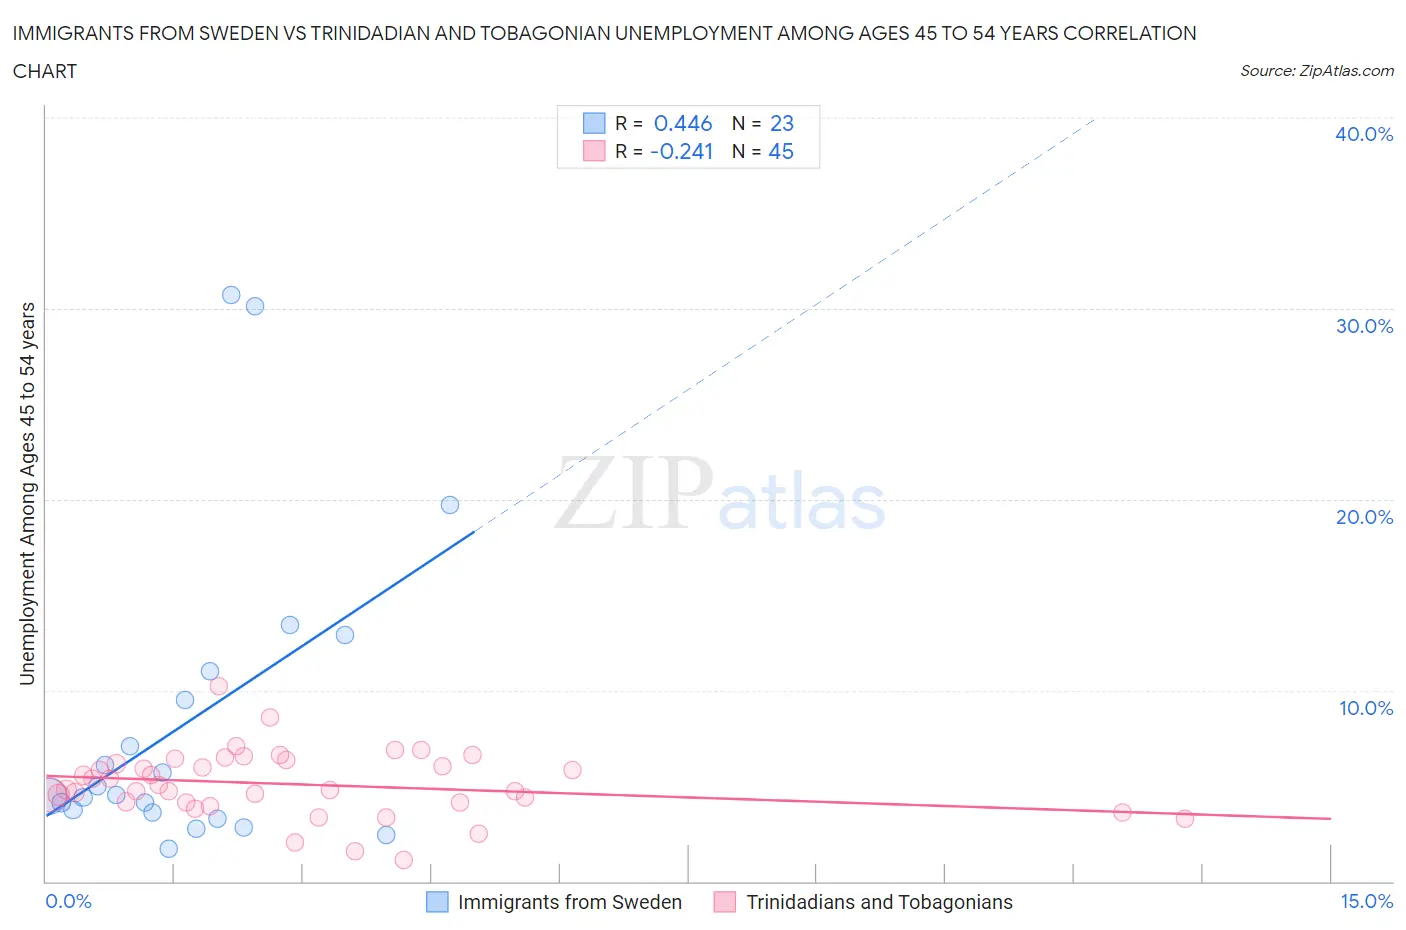
Immigrants from Sweden vs Trinidadian and Tobagonian Unemployment Among Ages 45 to 54 years Correlation Chart
The statistical analysis conducted on geographies consisting of 162,896,301 people shows a moderate positive correlation between the proportion of Immigrants from Sweden and unemployment rate among population between the ages 45 and 54 in the United States with a correlation coefficient (R) of 0.446 and weighted average of 4.4%. Similarly, the statistical analysis conducted on geographies consisting of 216,980,624 people shows a weak negative correlation between the proportion of Trinidadians and Tobagonians and unemployment rate among population between the ages 45 and 54 in the United States with a correlation coefficient (R) of -0.241 and weighted average of 5.2%, a difference of 18.9%.
Unemployment Among Ages 45 to 54 years Correlation Summary
| Measurement | Immigrants from Sweden | Trinidadian and Tobagonian |
| Minimum | 1.7% | 1.1% |
| Maximum | 30.7% | 10.2% |
| Range | 29.0% | 9.1% |
| Mean | 8.4% | 5.1% |
| Median | 4.5% | 4.8% |
| Interquartile 25% (IQ1) | 3.6% | 4.1% |
| Interquartile 75% (IQ3) | 11.0% | 6.2% |
| Interquartile Range (IQR) | 7.4% | 2.1% |
| Standard Deviation (Sample) | 8.2% | 1.7% |
| Standard Deviation (Population) | 8.0% | 1.7% |
Similar Demographics by Unemployment Among Ages 45 to 54 years
Demographics Similar to Immigrants from Sweden by Unemployment Among Ages 45 to 54 years
In terms of unemployment among ages 45 to 54 years, the demographic groups most similar to Immigrants from Sweden are Immigrants from Kenya (4.4%, a difference of 0.020%), Iranian (4.4%, a difference of 0.090%), Immigrants from South Africa (4.4%, a difference of 0.090%), Icelander (4.4%, a difference of 0.10%), and Sri Lankan (4.4%, a difference of 0.13%).
| Demographics | Rating | Rank | Unemployment Among Ages 45 to 54 years |
| Immigrants | Canada | 95.0 /100 | #97 | Exceptional 4.4% |
| Romanians | 94.9 /100 | #98 | Exceptional 4.4% |
| Immigrants | Burma/Myanmar | 94.9 /100 | #99 | Exceptional 4.4% |
| Immigrants | Eritrea | 94.7 /100 | #100 | Exceptional 4.4% |
| Immigrants | North America | 93.9 /100 | #101 | Exceptional 4.4% |
| Sri Lankans | 93.7 /100 | #102 | Exceptional 4.4% |
| Icelanders | 93.5 /100 | #103 | Exceptional 4.4% |
| Immigrants | Sweden | 93.0 /100 | #104 | Exceptional 4.4% |
| Immigrants | Kenya | 92.8 /100 | #105 | Exceptional 4.4% |
| Iranians | 92.5 /100 | #106 | Exceptional 4.4% |
| Immigrants | South Africa | 92.5 /100 | #107 | Exceptional 4.4% |
| Russians | 92.1 /100 | #108 | Exceptional 4.4% |
| New Zealanders | 91.9 /100 | #109 | Exceptional 4.4% |
| Immigrants | England | 91.3 /100 | #110 | Exceptional 4.4% |
| Immigrants | Nicaragua | 91.3 /100 | #111 | Exceptional 4.4% |
Demographics Similar to Trinidadians and Tobagonians by Unemployment Among Ages 45 to 54 years
In terms of unemployment among ages 45 to 54 years, the demographic groups most similar to Trinidadians and Tobagonians are Immigrants from Senegal (5.2%, a difference of 0.010%), Immigrants from Portugal (5.2%, a difference of 0.24%), Armenian (5.2%, a difference of 0.24%), Immigrants from Haiti (5.2%, a difference of 0.40%), and Belizean (5.2%, a difference of 0.59%).
| Demographics | Rating | Rank | Unemployment Among Ages 45 to 54 years |
| Iroquois | 0.0 /100 | #285 | Tragic 5.1% |
| Senegalese | 0.0 /100 | #286 | Tragic 5.1% |
| Haitians | 0.0 /100 | #287 | Tragic 5.2% |
| Immigrants | Caribbean | 0.0 /100 | #288 | Tragic 5.2% |
| Immigrants | Haiti | 0.0 /100 | #289 | Tragic 5.2% |
| Immigrants | Portugal | 0.0 /100 | #290 | Tragic 5.2% |
| Armenians | 0.0 /100 | #291 | Tragic 5.2% |
| Trinidadians and Tobagonians | 0.0 /100 | #292 | Tragic 5.2% |
| Immigrants | Senegal | 0.0 /100 | #293 | Tragic 5.2% |
| Belizeans | 0.0 /100 | #294 | Tragic 5.2% |
| Jamaicans | 0.0 /100 | #295 | Tragic 5.3% |
| Aleuts | 0.0 /100 | #296 | Tragic 5.3% |
| West Indians | 0.0 /100 | #297 | Tragic 5.3% |
| Immigrants | Trinidad and Tobago | 0.0 /100 | #298 | Tragic 5.3% |
| Ecuadorians | 0.0 /100 | #299 | Tragic 5.3% |