Immigrants from Sweden vs Immigrants from the Azores Child Poverty Under the Age of 5
COMPARE
Immigrants from Sweden
Immigrants from the Azores
Child Poverty Under the Age of 5
Child Poverty Under the Age of 5 Comparison
Immigrants from Sweden
Immigrants from the Azores
15.3%
CHILD POVERTY UNDER THE AGE OF 5
98.8/ 100
METRIC RATING
72nd/ 347
METRIC RANK
18.9%
CHILD POVERTY UNDER THE AGE OF 5
2.6/ 100
METRIC RATING
220th/ 347
METRIC RANK
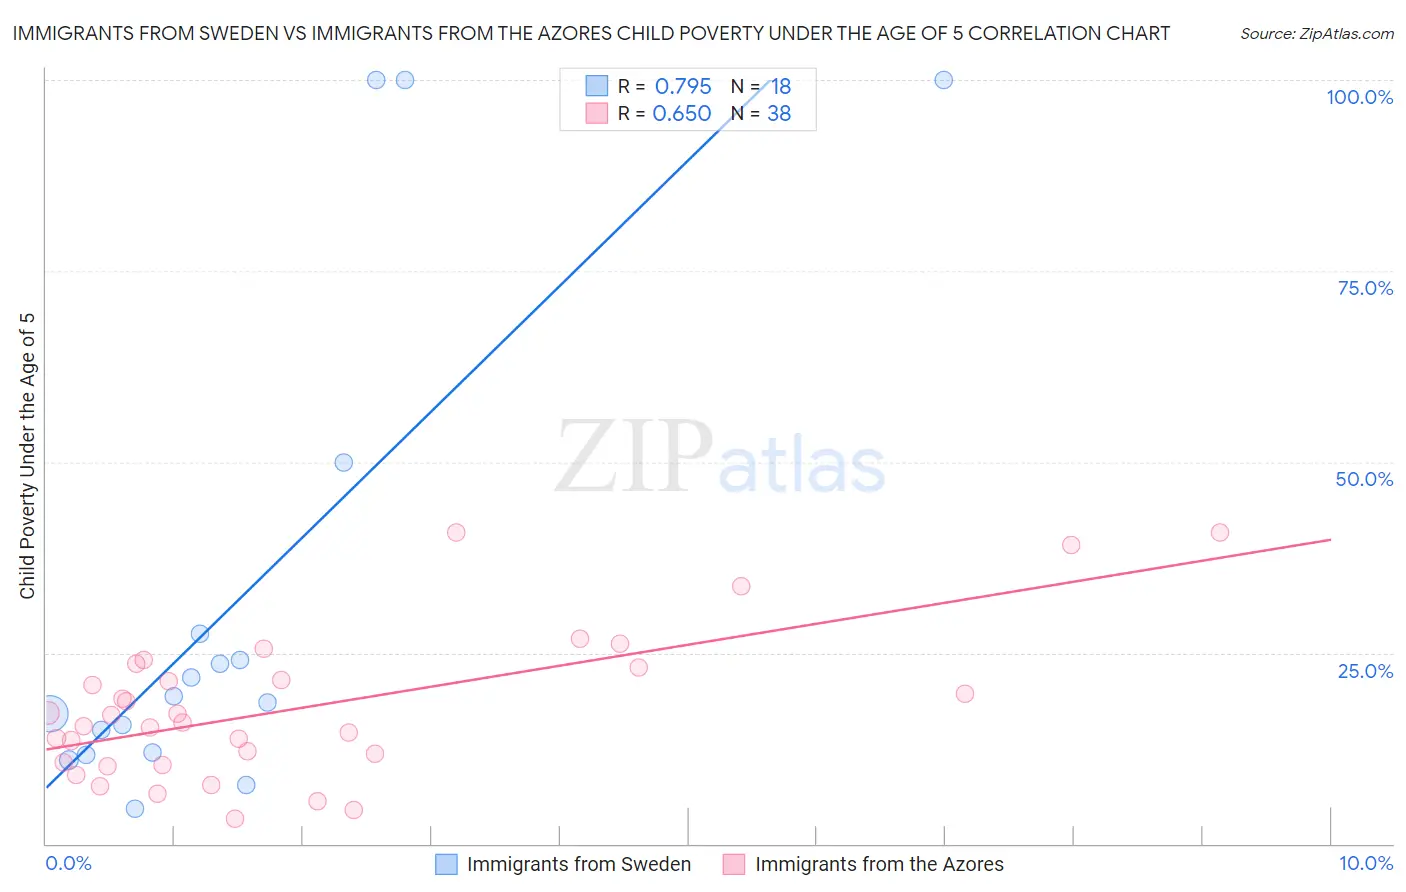
Immigrants from Sweden vs Immigrants from the Azores Child Poverty Under the Age of 5 Correlation Chart
The statistical analysis conducted on geographies consisting of 159,371,189 people shows a strong positive correlation between the proportion of Immigrants from Sweden and poverty level among children under the age of 5 in the United States with a correlation coefficient (R) of 0.795 and weighted average of 15.3%. Similarly, the statistical analysis conducted on geographies consisting of 45,317,352 people shows a significant positive correlation between the proportion of Immigrants from the Azores and poverty level among children under the age of 5 in the United States with a correlation coefficient (R) of 0.650 and weighted average of 18.9%, a difference of 23.5%.
Child Poverty Under the Age of 5 Correlation Summary
| Measurement | Immigrants from Sweden | Immigrants from the Azores |
| Minimum | 4.7% | 3.3% |
| Maximum | 100.0% | 40.8% |
| Range | 95.3% | 37.5% |
| Mean | 32.2% | 17.8% |
| Median | 18.9% | 16.4% |
| Interquartile 25% (IQ1) | 12.0% | 10.6% |
| Interquartile 75% (IQ3) | 27.5% | 23.2% |
| Interquartile Range (IQR) | 15.4% | 12.6% |
| Standard Deviation (Sample) | 32.7% | 9.6% |
| Standard Deviation (Population) | 31.8% | 9.4% |
Similar Demographics by Child Poverty Under the Age of 5
Demographics Similar to Immigrants from Sweden by Child Poverty Under the Age of 5
In terms of child poverty under the age of 5, the demographic groups most similar to Immigrants from Sweden are Immigrants from Belgium (15.3%, a difference of 0.070%), Immigrants from Egypt (15.3%, a difference of 0.070%), Immigrants from Ukraine (15.3%, a difference of 0.23%), Lithuanian (15.2%, a difference of 0.50%), and Greek (15.2%, a difference of 0.52%).
| Demographics | Rating | Rank | Child Poverty Under the Age of 5 |
| Immigrants | Fiji | 99.0 /100 | #65 | Exceptional 15.2% |
| Immigrants | Scotland | 99.0 /100 | #66 | Exceptional 15.2% |
| Greeks | 99.0 /100 | #67 | Exceptional 15.2% |
| Zimbabweans | 99.0 /100 | #68 | Exceptional 15.2% |
| Lithuanians | 99.0 /100 | #69 | Exceptional 15.2% |
| Immigrants | Belgium | 98.8 /100 | #70 | Exceptional 15.3% |
| Immigrants | Egypt | 98.8 /100 | #71 | Exceptional 15.3% |
| Immigrants | Sweden | 98.8 /100 | #72 | Exceptional 15.3% |
| Immigrants | Ukraine | 98.7 /100 | #73 | Exceptional 15.3% |
| Argentineans | 98.5 /100 | #74 | Exceptional 15.4% |
| Immigrants | Argentina | 98.5 /100 | #75 | Exceptional 15.4% |
| Croatians | 98.5 /100 | #76 | Exceptional 15.4% |
| Immigrants | Turkey | 98.3 /100 | #77 | Exceptional 15.4% |
| Sri Lankans | 98.1 /100 | #78 | Exceptional 15.5% |
| Australians | 98.0 /100 | #79 | Exceptional 15.5% |
Demographics Similar to Immigrants from the Azores by Child Poverty Under the Age of 5
In terms of child poverty under the age of 5, the demographic groups most similar to Immigrants from the Azores are German Russian (18.8%, a difference of 0.36%), Immigrants from Nigeria (19.0%, a difference of 0.56%), Delaware (18.7%, a difference of 0.67%), Alsatian (19.1%, a difference of 1.1%), and Cuban (19.1%, a difference of 1.1%).
| Demographics | Rating | Rank | Child Poverty Under the Age of 5 |
| Immigrants | Thailand | 8.6 /100 | #213 | Tragic 18.3% |
| Malaysians | 6.5 /100 | #214 | Tragic 18.4% |
| Immigrants | Panama | 6.0 /100 | #215 | Tragic 18.5% |
| Hmong | 5.0 /100 | #216 | Tragic 18.5% |
| Immigrants | Africa | 4.6 /100 | #217 | Tragic 18.6% |
| Delaware | 3.4 /100 | #218 | Tragic 18.7% |
| German Russians | 3.0 /100 | #219 | Tragic 18.8% |
| Immigrants | Azores | 2.6 /100 | #220 | Tragic 18.9% |
| Immigrants | Nigeria | 2.1 /100 | #221 | Tragic 19.0% |
| Alsatians | 1.7 /100 | #222 | Tragic 19.1% |
| Cubans | 1.7 /100 | #223 | Tragic 19.1% |
| Nicaraguans | 1.6 /100 | #224 | Tragic 19.1% |
| Nigerians | 1.6 /100 | #225 | Tragic 19.1% |
| Immigrants | Eritrea | 1.5 /100 | #226 | Tragic 19.1% |
| Cape Verdeans | 1.4 /100 | #227 | Tragic 19.1% |