Immigrants from Sweden vs Immigrants from Zaire Child Poverty Under the Age of 5
COMPARE
Immigrants from Sweden
Immigrants from Zaire
Child Poverty Under the Age of 5
Child Poverty Under the Age of 5 Comparison
Immigrants from Sweden
Immigrants from Zaire
15.3%
CHILD POVERTY UNDER THE AGE OF 5
98.8/ 100
METRIC RATING
72nd/ 347
METRIC RANK
21.3%
CHILD POVERTY UNDER THE AGE OF 5
0.0/ 100
METRIC RATING
287th/ 347
METRIC RANK
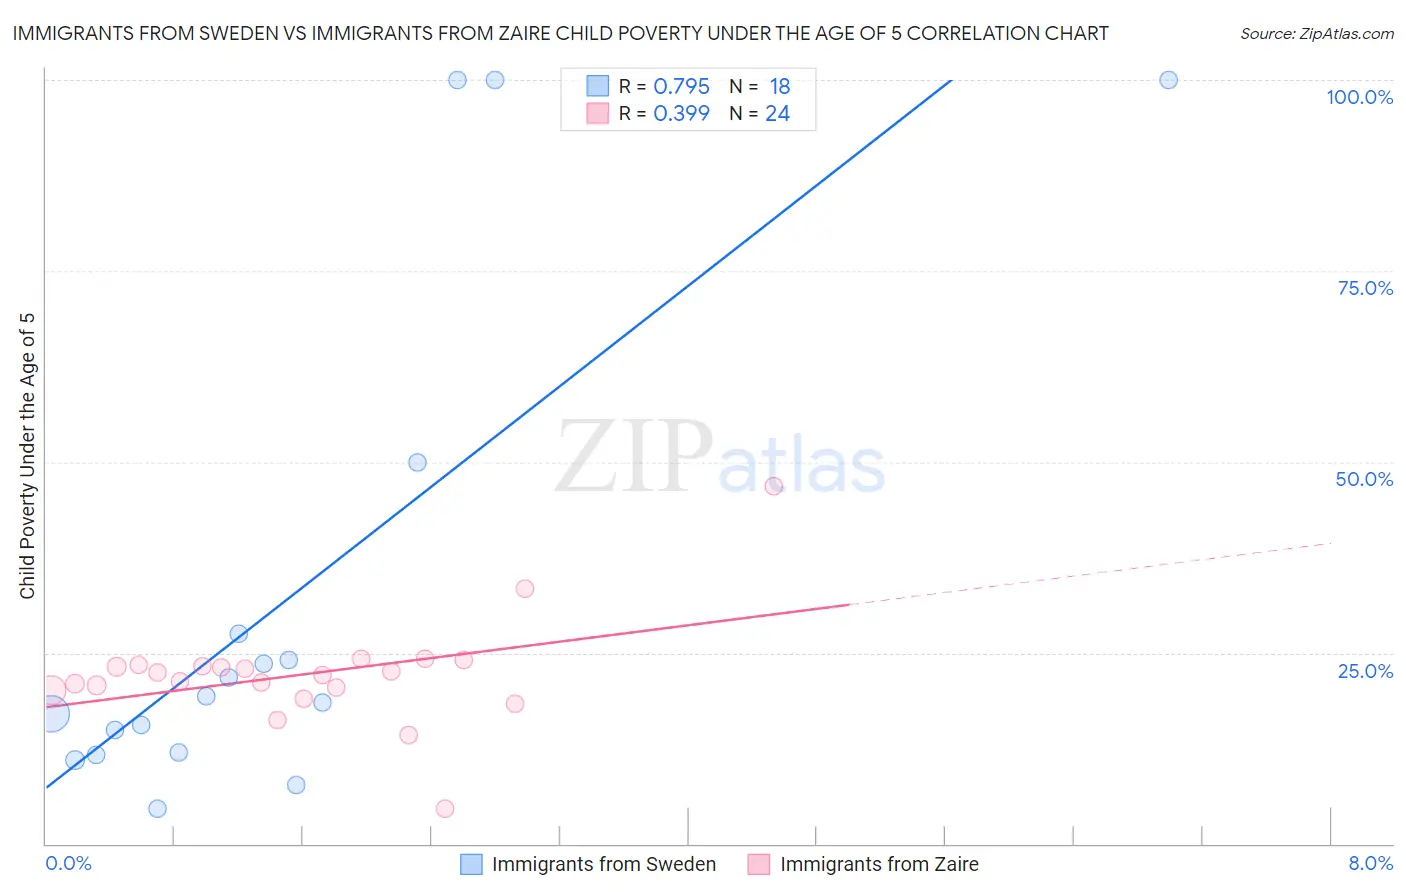
Immigrants from Sweden vs Immigrants from Zaire Child Poverty Under the Age of 5 Correlation Chart
The statistical analysis conducted on geographies consisting of 159,371,189 people shows a strong positive correlation between the proportion of Immigrants from Sweden and poverty level among children under the age of 5 in the United States with a correlation coefficient (R) of 0.795 and weighted average of 15.3%. Similarly, the statistical analysis conducted on geographies consisting of 106,157,538 people shows a mild positive correlation between the proportion of Immigrants from Zaire and poverty level among children under the age of 5 in the United States with a correlation coefficient (R) of 0.399 and weighted average of 21.3%, a difference of 39.2%.
Child Poverty Under the Age of 5 Correlation Summary
| Measurement | Immigrants from Sweden | Immigrants from Zaire |
| Minimum | 4.7% | 4.6% |
| Maximum | 100.0% | 46.8% |
| Range | 95.3% | 42.2% |
| Mean | 32.2% | 22.2% |
| Median | 18.9% | 22.2% |
| Interquartile 25% (IQ1) | 12.0% | 20.3% |
| Interquartile 75% (IQ3) | 27.5% | 23.3% |
| Interquartile Range (IQR) | 15.4% | 3.0% |
| Standard Deviation (Sample) | 32.7% | 7.2% |
| Standard Deviation (Population) | 31.8% | 7.0% |
Similar Demographics by Child Poverty Under the Age of 5
Demographics Similar to Immigrants from Sweden by Child Poverty Under the Age of 5
In terms of child poverty under the age of 5, the demographic groups most similar to Immigrants from Sweden are Immigrants from Belgium (15.3%, a difference of 0.070%), Immigrants from Egypt (15.3%, a difference of 0.070%), Immigrants from Ukraine (15.3%, a difference of 0.23%), Lithuanian (15.2%, a difference of 0.50%), and Greek (15.2%, a difference of 0.52%).
| Demographics | Rating | Rank | Child Poverty Under the Age of 5 |
| Immigrants | Fiji | 99.0 /100 | #65 | Exceptional 15.2% |
| Immigrants | Scotland | 99.0 /100 | #66 | Exceptional 15.2% |
| Greeks | 99.0 /100 | #67 | Exceptional 15.2% |
| Zimbabweans | 99.0 /100 | #68 | Exceptional 15.2% |
| Lithuanians | 99.0 /100 | #69 | Exceptional 15.2% |
| Immigrants | Belgium | 98.8 /100 | #70 | Exceptional 15.3% |
| Immigrants | Egypt | 98.8 /100 | #71 | Exceptional 15.3% |
| Immigrants | Sweden | 98.8 /100 | #72 | Exceptional 15.3% |
| Immigrants | Ukraine | 98.7 /100 | #73 | Exceptional 15.3% |
| Argentineans | 98.5 /100 | #74 | Exceptional 15.4% |
| Immigrants | Argentina | 98.5 /100 | #75 | Exceptional 15.4% |
| Croatians | 98.5 /100 | #76 | Exceptional 15.4% |
| Immigrants | Turkey | 98.3 /100 | #77 | Exceptional 15.4% |
| Sri Lankans | 98.1 /100 | #78 | Exceptional 15.5% |
| Australians | 98.0 /100 | #79 | Exceptional 15.5% |
Demographics Similar to Immigrants from Zaire by Child Poverty Under the Age of 5
In terms of child poverty under the age of 5, the demographic groups most similar to Immigrants from Zaire are Immigrants from Latin America (21.2%, a difference of 0.090%), Haitian (21.2%, a difference of 0.17%), Immigrants from Senegal (21.3%, a difference of 0.17%), Immigrants from Haiti (21.3%, a difference of 0.25%), and Somali (21.1%, a difference of 0.64%).
| Demographics | Rating | Rank | Child Poverty Under the Age of 5 |
| French American Indians | 0.0 /100 | #280 | Tragic 20.8% |
| Senegalese | 0.0 /100 | #281 | Tragic 20.9% |
| Potawatomi | 0.0 /100 | #282 | Tragic 21.0% |
| Comanche | 0.0 /100 | #283 | Tragic 21.0% |
| Somalis | 0.0 /100 | #284 | Tragic 21.1% |
| Haitians | 0.0 /100 | #285 | Tragic 21.2% |
| Immigrants | Latin America | 0.0 /100 | #286 | Tragic 21.2% |
| Immigrants | Zaire | 0.0 /100 | #287 | Tragic 21.3% |
| Immigrants | Senegal | 0.0 /100 | #288 | Tragic 21.3% |
| Immigrants | Haiti | 0.0 /100 | #289 | Tragic 21.3% |
| Immigrants | Caribbean | 0.0 /100 | #290 | Tragic 21.4% |
| British West Indians | 0.0 /100 | #291 | Tragic 21.4% |
| Immigrants | Somalia | 0.0 /100 | #292 | Tragic 21.6% |
| Mexicans | 0.0 /100 | #293 | Tragic 21.6% |
| Guatemalans | 0.0 /100 | #294 | Tragic 21.6% |