Immigrants from Sweden vs Peruvian Female Poverty
COMPARE
Immigrants from Sweden
Peruvian
Female Poverty
Female Poverty Comparison
Immigrants from Sweden
Peruvians
12.3%
FEMALE POVERTY
97.1/ 100
METRIC RATING
81st/ 347
METRIC RANK
12.9%
FEMALE POVERTY
85.2/ 100
METRIC RATING
136th/ 347
METRIC RANK
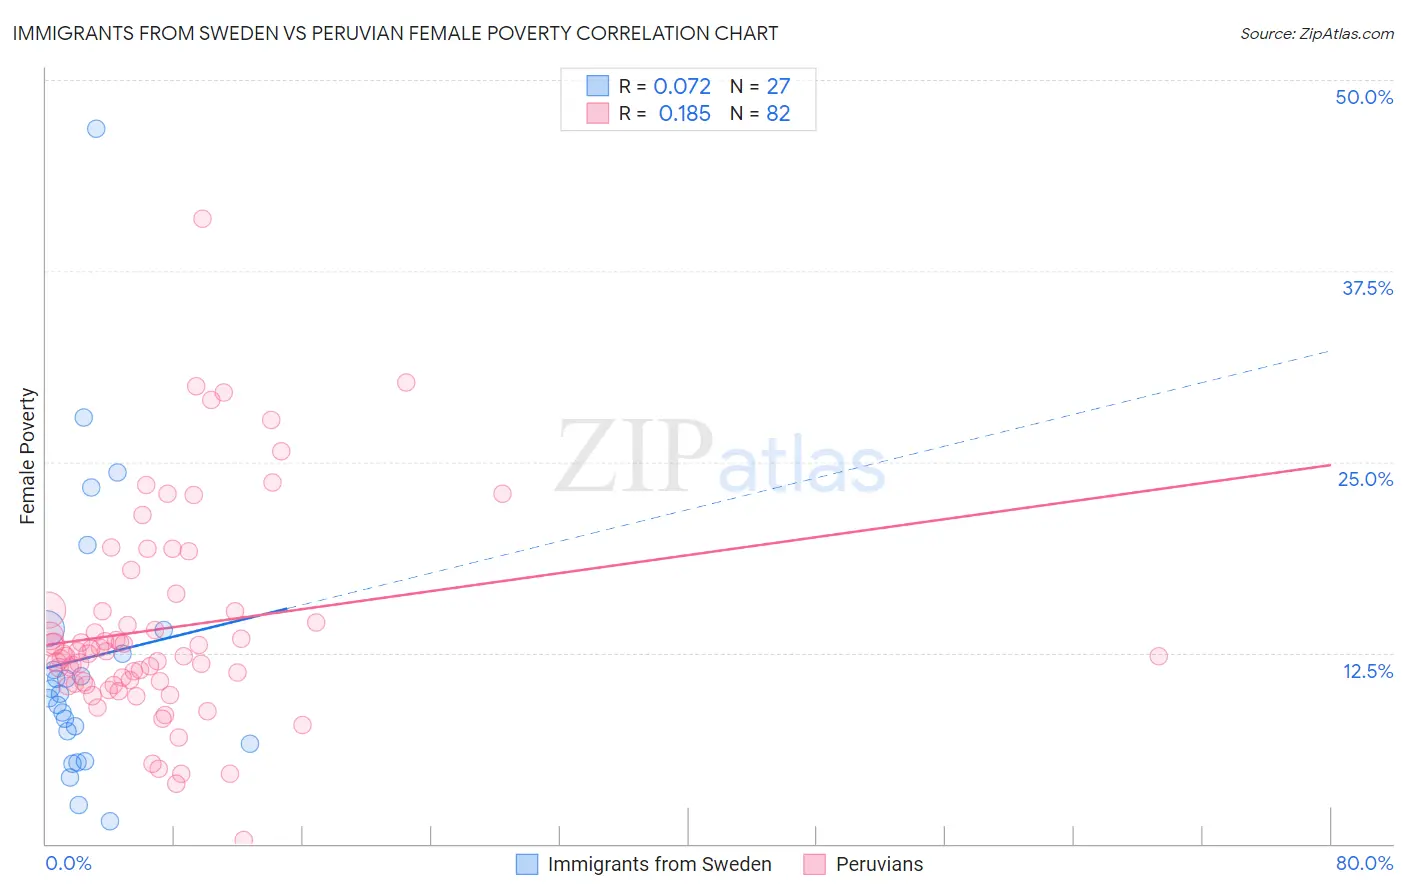
Immigrants from Sweden vs Peruvian Female Poverty Correlation Chart
The statistical analysis conducted on geographies consisting of 164,683,428 people shows a slight positive correlation between the proportion of Immigrants from Sweden and poverty level among females in the United States with a correlation coefficient (R) of 0.072 and weighted average of 12.3%. Similarly, the statistical analysis conducted on geographies consisting of 362,941,638 people shows a poor positive correlation between the proportion of Peruvians and poverty level among females in the United States with a correlation coefficient (R) of 0.185 and weighted average of 12.9%, a difference of 4.6%.
Female Poverty Correlation Summary
| Measurement | Immigrants from Sweden | Peruvian |
| Minimum | 1.5% | 0.21% |
| Maximum | 46.8% | 40.9% |
| Range | 45.4% | 40.7% |
| Mean | 12.1% | 14.1% |
| Median | 9.8% | 12.5% |
| Interquartile 25% (IQ1) | 6.5% | 10.5% |
| Interquartile 75% (IQ3) | 14.0% | 15.2% |
| Interquartile Range (IQR) | 7.5% | 4.8% |
| Standard Deviation (Sample) | 9.5% | 6.8% |
| Standard Deviation (Population) | 9.3% | 6.8% |
Similar Demographics by Female Poverty
Demographics Similar to Immigrants from Sweden by Female Poverty
In terms of female poverty, the demographic groups most similar to Immigrants from Sweden are Slovak (12.3%, a difference of 0.0%), Jordanian (12.3%, a difference of 0.010%), Immigrants from North America (12.3%, a difference of 0.050%), Egyptian (12.3%, a difference of 0.12%), and Serbian (12.3%, a difference of 0.13%).
| Demographics | Rating | Rank | Female Poverty |
| Immigrants | Canada | 97.5 /100 | #74 | Exceptional 12.3% |
| Europeans | 97.4 /100 | #75 | Exceptional 12.3% |
| Immigrants | Eastern Europe | 97.2 /100 | #76 | Exceptional 12.3% |
| Serbians | 97.2 /100 | #77 | Exceptional 12.3% |
| Egyptians | 97.2 /100 | #78 | Exceptional 12.3% |
| Immigrants | North America | 97.1 /100 | #79 | Exceptional 12.3% |
| Slovaks | 97.1 /100 | #80 | Exceptional 12.3% |
| Immigrants | Sweden | 97.1 /100 | #81 | Exceptional 12.3% |
| Jordanians | 97.1 /100 | #82 | Exceptional 12.3% |
| Immigrants | England | 96.9 /100 | #83 | Exceptional 12.3% |
| Northern Europeans | 96.6 /100 | #84 | Exceptional 12.4% |
| Irish | 96.5 /100 | #85 | Exceptional 12.4% |
| Dutch | 96.5 /100 | #86 | Exceptional 12.4% |
| Okinawans | 96.4 /100 | #87 | Exceptional 12.4% |
| Finns | 96.4 /100 | #88 | Exceptional 12.4% |
Demographics Similar to Peruvians by Female Poverty
In terms of female poverty, the demographic groups most similar to Peruvians are French (12.9%, a difference of 0.080%), Chilean (12.9%, a difference of 0.090%), Immigrants from Switzerland (12.9%, a difference of 0.13%), Immigrants from Western Europe (12.8%, a difference of 0.30%), and Immigrants from France (12.9%, a difference of 0.31%).
| Demographics | Rating | Rank | Female Poverty |
| Immigrants | Brazil | 87.9 /100 | #129 | Excellent 12.8% |
| Immigrants | Vietnam | 87.1 /100 | #130 | Excellent 12.8% |
| Immigrants | Argentina | 87.0 /100 | #131 | Excellent 12.8% |
| Immigrants | Jordan | 86.9 /100 | #132 | Excellent 12.8% |
| Immigrants | Western Europe | 86.6 /100 | #133 | Excellent 12.8% |
| Immigrants | Switzerland | 85.8 /100 | #134 | Excellent 12.9% |
| French | 85.6 /100 | #135 | Excellent 12.9% |
| Peruvians | 85.2 /100 | #136 | Excellent 12.9% |
| Chileans | 84.7 /100 | #137 | Excellent 12.9% |
| Immigrants | France | 83.6 /100 | #138 | Excellent 12.9% |
| Basques | 83.1 /100 | #139 | Excellent 12.9% |
| Pakistanis | 83.0 /100 | #140 | Excellent 12.9% |
| Icelanders | 81.1 /100 | #141 | Excellent 13.0% |
| Brazilians | 80.5 /100 | #142 | Excellent 13.0% |
| Immigrants | Malaysia | 80.4 /100 | #143 | Excellent 13.0% |