Immigrants from Sweden vs Immigrants from Burma/Myanmar Female Poverty
COMPARE
Immigrants from Sweden
Immigrants from Burma/Myanmar
Female Poverty
Female Poverty Comparison
Immigrants from Sweden
Immigrants from Burma/Myanmar
12.3%
FEMALE POVERTY
97.1/ 100
METRIC RATING
81st/ 347
METRIC RANK
15.4%
FEMALE POVERTY
0.3/ 100
METRIC RATING
252nd/ 347
METRIC RANK
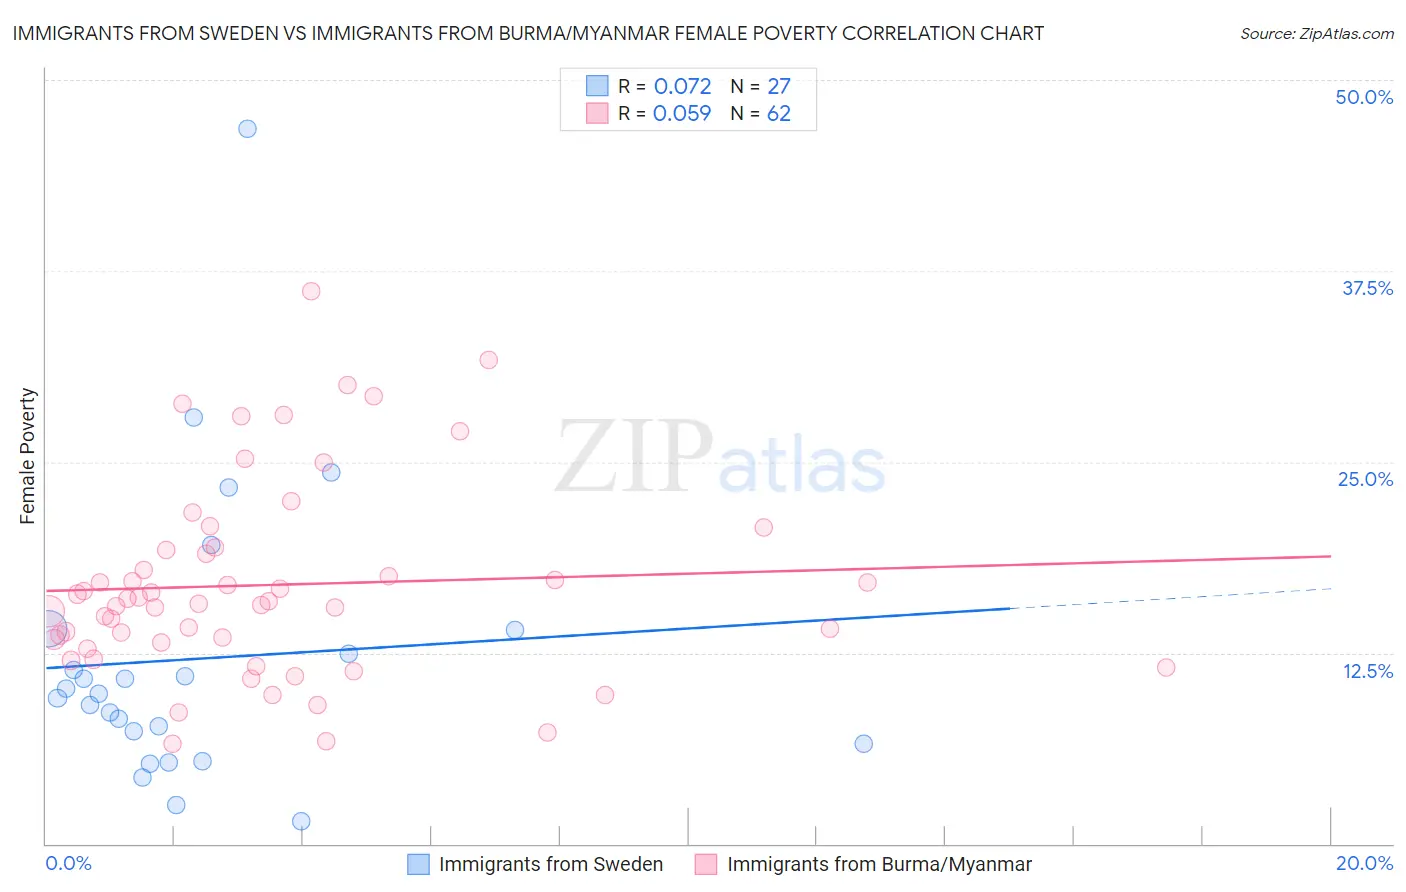
Immigrants from Sweden vs Immigrants from Burma/Myanmar Female Poverty Correlation Chart
The statistical analysis conducted on geographies consisting of 164,683,428 people shows a slight positive correlation between the proportion of Immigrants from Sweden and poverty level among females in the United States with a correlation coefficient (R) of 0.072 and weighted average of 12.3%. Similarly, the statistical analysis conducted on geographies consisting of 172,266,194 people shows a slight positive correlation between the proportion of Immigrants from Burma/Myanmar and poverty level among females in the United States with a correlation coefficient (R) of 0.059 and weighted average of 15.4%, a difference of 24.8%.
Female Poverty Correlation Summary
| Measurement | Immigrants from Sweden | Immigrants from Burma/Myanmar |
| Minimum | 1.5% | 6.5% |
| Maximum | 46.8% | 36.2% |
| Range | 45.4% | 29.7% |
| Mean | 12.1% | 17.0% |
| Median | 9.8% | 15.8% |
| Interquartile 25% (IQ1) | 6.5% | 13.2% |
| Interquartile 75% (IQ3) | 14.0% | 19.2% |
| Interquartile Range (IQR) | 7.5% | 6.1% |
| Standard Deviation (Sample) | 9.5% | 6.4% |
| Standard Deviation (Population) | 9.3% | 6.4% |
Similar Demographics by Female Poverty
Demographics Similar to Immigrants from Sweden by Female Poverty
In terms of female poverty, the demographic groups most similar to Immigrants from Sweden are Slovak (12.3%, a difference of 0.0%), Jordanian (12.3%, a difference of 0.010%), Immigrants from North America (12.3%, a difference of 0.050%), Egyptian (12.3%, a difference of 0.12%), and Serbian (12.3%, a difference of 0.13%).
| Demographics | Rating | Rank | Female Poverty |
| Immigrants | Canada | 97.5 /100 | #74 | Exceptional 12.3% |
| Europeans | 97.4 /100 | #75 | Exceptional 12.3% |
| Immigrants | Eastern Europe | 97.2 /100 | #76 | Exceptional 12.3% |
| Serbians | 97.2 /100 | #77 | Exceptional 12.3% |
| Egyptians | 97.2 /100 | #78 | Exceptional 12.3% |
| Immigrants | North America | 97.1 /100 | #79 | Exceptional 12.3% |
| Slovaks | 97.1 /100 | #80 | Exceptional 12.3% |
| Immigrants | Sweden | 97.1 /100 | #81 | Exceptional 12.3% |
| Jordanians | 97.1 /100 | #82 | Exceptional 12.3% |
| Immigrants | England | 96.9 /100 | #83 | Exceptional 12.3% |
| Northern Europeans | 96.6 /100 | #84 | Exceptional 12.4% |
| Irish | 96.5 /100 | #85 | Exceptional 12.4% |
| Dutch | 96.5 /100 | #86 | Exceptional 12.4% |
| Okinawans | 96.4 /100 | #87 | Exceptional 12.4% |
| Finns | 96.4 /100 | #88 | Exceptional 12.4% |
Demographics Similar to Immigrants from Burma/Myanmar by Female Poverty
In terms of female poverty, the demographic groups most similar to Immigrants from Burma/Myanmar are Immigrants from Trinidad and Tobago (15.4%, a difference of 0.030%), Immigrants from Western Africa (15.3%, a difference of 0.19%), Salvadoran (15.3%, a difference of 0.23%), Liberian (15.4%, a difference of 0.26%), and Immigrants from Ghana (15.3%, a difference of 0.37%).
| Demographics | Rating | Rank | Female Poverty |
| Spanish American Indians | 0.3 /100 | #245 | Tragic 15.3% |
| Cubans | 0.3 /100 | #246 | Tragic 15.3% |
| Potawatomi | 0.3 /100 | #247 | Tragic 15.3% |
| Immigrants | Ghana | 0.3 /100 | #248 | Tragic 15.3% |
| Salvadorans | 0.3 /100 | #249 | Tragic 15.3% |
| Immigrants | Western Africa | 0.3 /100 | #250 | Tragic 15.3% |
| Immigrants | Trinidad and Tobago | 0.3 /100 | #251 | Tragic 15.4% |
| Immigrants | Burma/Myanmar | 0.3 /100 | #252 | Tragic 15.4% |
| Liberians | 0.2 /100 | #253 | Tragic 15.4% |
| Trinidadians and Tobagonians | 0.2 /100 | #254 | Tragic 15.4% |
| Ottawa | 0.2 /100 | #255 | Tragic 15.5% |
| Jamaicans | 0.2 /100 | #256 | Tragic 15.5% |
| Immigrants | Jamaica | 0.1 /100 | #257 | Tragic 15.6% |
| Shoshone | 0.1 /100 | #258 | Tragic 15.6% |
| Cape Verdeans | 0.1 /100 | #259 | Tragic 15.6% |