Immigrants from Sudan vs Hopi Seniors Poverty Over the Age of 75
COMPARE
Immigrants from Sudan
Hopi
Seniors Poverty Over the Age of 75
Seniors Poverty Over the Age of 75 Comparison
Immigrants from Sudan
Hopi
12.1%
SENIORS POVERTY OVER THE AGE OF 75
61.7/ 100
METRIC RATING
157th/ 347
METRIC RANK
18.9%
SENIORS POVERTY OVER THE AGE OF 75
0.0/ 100
METRIC RATING
339th/ 347
METRIC RANK
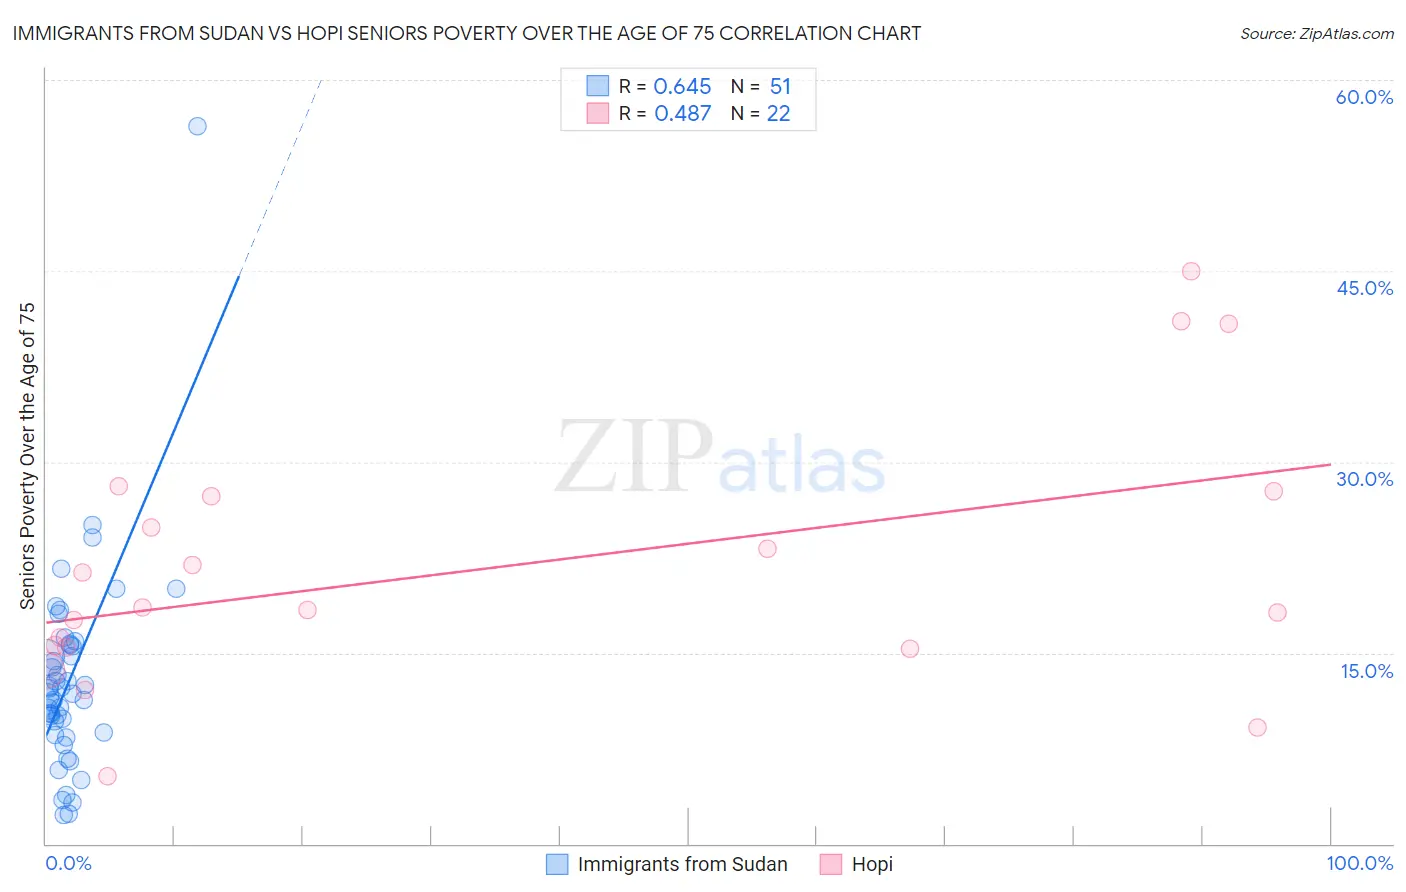
Immigrants from Sudan vs Hopi Seniors Poverty Over the Age of 75 Correlation Chart
The statistical analysis conducted on geographies consisting of 118,554,808 people shows a significant positive correlation between the proportion of Immigrants from Sudan and poverty level among seniors over the age of 75 in the United States with a correlation coefficient (R) of 0.645 and weighted average of 12.1%. Similarly, the statistical analysis conducted on geographies consisting of 74,452,894 people shows a moderate positive correlation between the proportion of Hopi and poverty level among seniors over the age of 75 in the United States with a correlation coefficient (R) of 0.487 and weighted average of 18.9%, a difference of 56.2%.
Seniors Poverty Over the Age of 75 Correlation Summary
| Measurement | Immigrants from Sudan | Hopi |
| Minimum | 2.2% | 5.3% |
| Maximum | 56.4% | 45.0% |
| Range | 54.2% | 39.7% |
| Mean | 12.9% | 21.7% |
| Median | 11.8% | 18.5% |
| Interquartile 25% (IQ1) | 8.7% | 15.4% |
| Interquartile 75% (IQ3) | 15.6% | 27.3% |
| Interquartile Range (IQR) | 6.9% | 11.8% |
| Standard Deviation (Sample) | 8.2% | 10.2% |
| Standard Deviation (Population) | 8.1% | 10.0% |
Similar Demographics by Seniors Poverty Over the Age of 75
Demographics Similar to Immigrants from Sudan by Seniors Poverty Over the Age of 75
In terms of seniors poverty over the age of 75, the demographic groups most similar to Immigrants from Sudan are Portuguese (12.1%, a difference of 0.040%), Immigrants from Middle Africa (12.1%, a difference of 0.040%), Immigrants from Burma/Myanmar (12.1%, a difference of 0.060%), Immigrants from Eastern Africa (12.1%, a difference of 0.070%), and Indonesian (12.1%, a difference of 0.080%).
| Demographics | Rating | Rank | Seniors Poverty Over the Age of 75 |
| Cypriots | 67.3 /100 | #150 | Good 12.0% |
| Cherokee | 65.8 /100 | #151 | Good 12.0% |
| Immigrants | Korea | 65.5 /100 | #152 | Good 12.0% |
| Immigrants | Turkey | 64.7 /100 | #153 | Good 12.0% |
| Cambodians | 64.0 /100 | #154 | Good 12.0% |
| Indonesians | 62.6 /100 | #155 | Good 12.1% |
| Immigrants | Burma/Myanmar | 62.3 /100 | #156 | Good 12.1% |
| Immigrants | Sudan | 61.7 /100 | #157 | Good 12.1% |
| Portuguese | 61.3 /100 | #158 | Good 12.1% |
| Immigrants | Middle Africa | 61.2 /100 | #159 | Good 12.1% |
| Immigrants | Eastern Africa | 60.9 /100 | #160 | Good 12.1% |
| Immigrants | Norway | 60.6 /100 | #161 | Good 12.1% |
| Immigrants | Serbia | 60.2 /100 | #162 | Good 12.1% |
| Immigrants | Greece | 58.2 /100 | #163 | Average 12.1% |
| Potawatomi | 57.4 /100 | #164 | Average 12.1% |
Demographics Similar to Hopi by Seniors Poverty Over the Age of 75
In terms of seniors poverty over the age of 75, the demographic groups most similar to Hopi are Tohono O'odham (19.1%, a difference of 1.5%), Immigrants from Cabo Verde (18.5%, a difference of 2.0%), Navajo (19.4%, a difference of 2.8%), Yakama (18.3%, a difference of 2.9%), and Immigrants from Caribbean (18.2%, a difference of 3.4%).
| Demographics | Rating | Rank | Seniors Poverty Over the Age of 75 |
| Immigrants | St. Vincent and the Grenadines | 0.0 /100 | #332 | Tragic 17.5% |
| Immigrants | Nicaragua | 0.0 /100 | #333 | Tragic 17.6% |
| Immigrants | Grenada | 0.0 /100 | #334 | Tragic 17.8% |
| Cubans | 0.0 /100 | #335 | Tragic 18.0% |
| Immigrants | Caribbean | 0.0 /100 | #336 | Tragic 18.2% |
| Yakama | 0.0 /100 | #337 | Tragic 18.3% |
| Immigrants | Cabo Verde | 0.0 /100 | #338 | Tragic 18.5% |
| Hopi | 0.0 /100 | #339 | Tragic 18.9% |
| Tohono O'odham | 0.0 /100 | #340 | Tragic 19.1% |
| Navajo | 0.0 /100 | #341 | Tragic 19.4% |
| Dominicans | 0.0 /100 | #342 | Tragic 19.6% |
| Lumbee | 0.0 /100 | #343 | Tragic 19.7% |
| Immigrants | Cuba | 0.0 /100 | #344 | Tragic 19.9% |
| Immigrants | Dominican Republic | 0.0 /100 | #345 | Tragic 20.1% |
| Puerto Ricans | 0.0 /100 | #346 | Tragic 23.2% |