Immigrants from Sudan vs Mongolian Seniors Poverty Over the Age of 75
COMPARE
Immigrants from Sudan
Mongolian
Seniors Poverty Over the Age of 75
Seniors Poverty Over the Age of 75 Comparison
Immigrants from Sudan
Mongolians
12.1%
SENIORS POVERTY OVER THE AGE OF 75
61.7/ 100
METRIC RATING
157th/ 347
METRIC RANK
12.2%
SENIORS POVERTY OVER THE AGE OF 75
45.5/ 100
METRIC RATING
179th/ 347
METRIC RANK
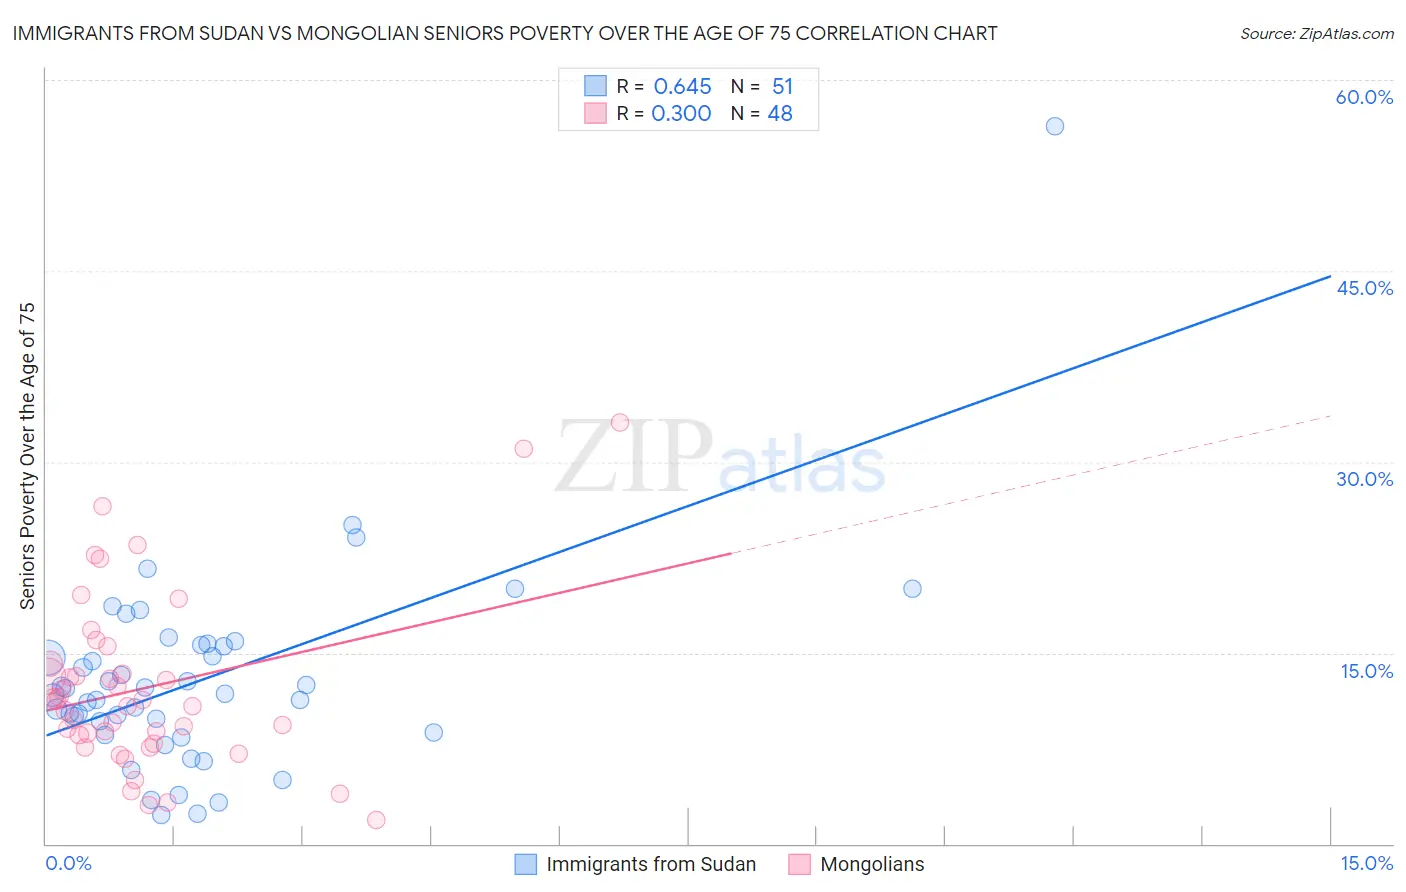
Immigrants from Sudan vs Mongolian Seniors Poverty Over the Age of 75 Correlation Chart
The statistical analysis conducted on geographies consisting of 118,554,808 people shows a significant positive correlation between the proportion of Immigrants from Sudan and poverty level among seniors over the age of 75 in the United States with a correlation coefficient (R) of 0.645 and weighted average of 12.1%. Similarly, the statistical analysis conducted on geographies consisting of 139,832,325 people shows a weak positive correlation between the proportion of Mongolians and poverty level among seniors over the age of 75 in the United States with a correlation coefficient (R) of 0.300 and weighted average of 12.2%, a difference of 1.3%.
Seniors Poverty Over the Age of 75 Correlation Summary
| Measurement | Immigrants from Sudan | Mongolian |
| Minimum | 2.2% | 1.9% |
| Maximum | 56.4% | 33.1% |
| Range | 54.2% | 31.3% |
| Mean | 12.9% | 12.2% |
| Median | 11.8% | 11.0% |
| Interquartile 25% (IQ1) | 8.7% | 8.2% |
| Interquartile 75% (IQ3) | 15.6% | 13.7% |
| Interquartile Range (IQR) | 6.9% | 5.5% |
| Standard Deviation (Sample) | 8.2% | 6.8% |
| Standard Deviation (Population) | 8.1% | 6.8% |
Similar Demographics by Seniors Poverty Over the Age of 75
Demographics Similar to Immigrants from Sudan by Seniors Poverty Over the Age of 75
In terms of seniors poverty over the age of 75, the demographic groups most similar to Immigrants from Sudan are Portuguese (12.1%, a difference of 0.040%), Immigrants from Middle Africa (12.1%, a difference of 0.040%), Immigrants from Burma/Myanmar (12.1%, a difference of 0.060%), Immigrants from Eastern Africa (12.1%, a difference of 0.070%), and Indonesian (12.1%, a difference of 0.080%).
| Demographics | Rating | Rank | Seniors Poverty Over the Age of 75 |
| Cypriots | 67.3 /100 | #150 | Good 12.0% |
| Cherokee | 65.8 /100 | #151 | Good 12.0% |
| Immigrants | Korea | 65.5 /100 | #152 | Good 12.0% |
| Immigrants | Turkey | 64.7 /100 | #153 | Good 12.0% |
| Cambodians | 64.0 /100 | #154 | Good 12.0% |
| Indonesians | 62.6 /100 | #155 | Good 12.1% |
| Immigrants | Burma/Myanmar | 62.3 /100 | #156 | Good 12.1% |
| Immigrants | Sudan | 61.7 /100 | #157 | Good 12.1% |
| Portuguese | 61.3 /100 | #158 | Good 12.1% |
| Immigrants | Middle Africa | 61.2 /100 | #159 | Good 12.1% |
| Immigrants | Eastern Africa | 60.9 /100 | #160 | Good 12.1% |
| Immigrants | Norway | 60.6 /100 | #161 | Good 12.1% |
| Immigrants | Serbia | 60.2 /100 | #162 | Good 12.1% |
| Immigrants | Greece | 58.2 /100 | #163 | Average 12.1% |
| Potawatomi | 57.4 /100 | #164 | Average 12.1% |
Demographics Similar to Mongolians by Seniors Poverty Over the Age of 75
In terms of seniors poverty over the age of 75, the demographic groups most similar to Mongolians are Immigrants from South Eastern Asia (12.2%, a difference of 0.10%), Nonimmigrants (12.2%, a difference of 0.11%), Immigrants from Australia (12.2%, a difference of 0.11%), Immigrants from Asia (12.2%, a difference of 0.19%), and Immigrants from Iran (12.2%, a difference of 0.21%).
| Demographics | Rating | Rank | Seniors Poverty Over the Age of 75 |
| Immigrants | Fiji | 51.5 /100 | #172 | Average 12.2% |
| Arabs | 50.5 /100 | #173 | Average 12.2% |
| Immigrants | Europe | 50.0 /100 | #174 | Average 12.2% |
| Immigrants | Saudi Arabia | 49.5 /100 | #175 | Average 12.2% |
| Immigrants | Iran | 48.1 /100 | #176 | Average 12.2% |
| Immigrants | Asia | 47.8 /100 | #177 | Average 12.2% |
| Immigrants | Nonimmigrants | 46.8 /100 | #178 | Average 12.2% |
| Mongolians | 45.5 /100 | #179 | Average 12.2% |
| Immigrants | South Eastern Asia | 44.3 /100 | #180 | Average 12.2% |
| Immigrants | Australia | 44.2 /100 | #181 | Average 12.2% |
| German Russians | 41.4 /100 | #182 | Average 12.3% |
| Laotians | 38.2 /100 | #183 | Fair 12.3% |
| Kiowa | 36.0 /100 | #184 | Fair 12.3% |
| Immigrants | Malaysia | 35.8 /100 | #185 | Fair 12.3% |
| Sri Lankans | 32.3 /100 | #186 | Fair 12.4% |