Immigrants from Sudan vs Black/African American 6th Grade
COMPARE
Immigrants from Sudan
Black/African American
6th Grade
6th Grade Comparison
Immigrants from Sudan
Blacks/African Americans
96.8%
6TH GRADE
8.7/ 100
METRIC RATING
213th/ 347
METRIC RANK
97.0%
6TH GRADE
30.2/ 100
METRIC RATING
189th/ 347
METRIC RANK
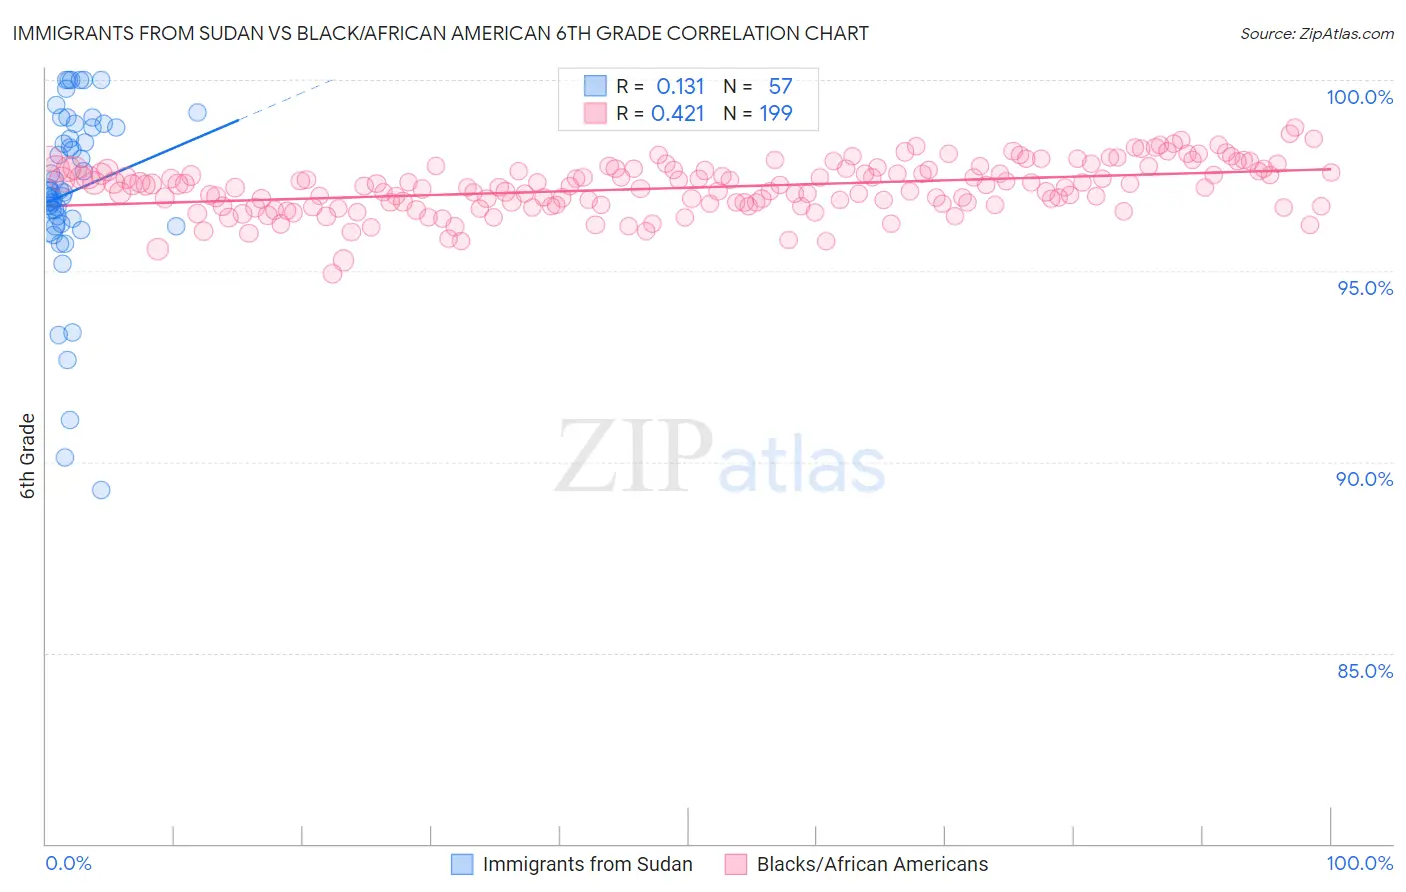
Immigrants from Sudan vs Black/African American 6th Grade Correlation Chart
The statistical analysis conducted on geographies consisting of 118,959,807 people shows a poor positive correlation between the proportion of Immigrants from Sudan and percentage of population with at least 6th grade education in the United States with a correlation coefficient (R) of 0.131 and weighted average of 96.8%. Similarly, the statistical analysis conducted on geographies consisting of 566,043,668 people shows a moderate positive correlation between the proportion of Blacks/African Americans and percentage of population with at least 6th grade education in the United States with a correlation coefficient (R) of 0.421 and weighted average of 97.0%, a difference of 0.17%.
6th Grade Correlation Summary
| Measurement | Immigrants from Sudan | Black/African American |
| Minimum | 89.3% | 94.9% |
| Maximum | 100.0% | 98.7% |
| Range | 10.7% | 3.8% |
| Mean | 97.1% | 97.2% |
| Median | 97.1% | 97.2% |
| Interquartile 25% (IQ1) | 96.2% | 96.7% |
| Interquartile 75% (IQ3) | 98.8% | 97.7% |
| Interquartile Range (IQR) | 2.6% | 0.92% |
| Standard Deviation (Sample) | 2.3% | 0.66% |
| Standard Deviation (Population) | 2.3% | 0.66% |
Similar Demographics by 6th Grade
Demographics Similar to Immigrants from Sudan by 6th Grade
In terms of 6th grade, the demographic groups most similar to Immigrants from Sudan are Moroccan (96.8%, a difference of 0.0%), Immigrants from Iraq (96.8%, a difference of 0.010%), Portuguese (96.8%, a difference of 0.010%), Sierra Leonean (96.8%, a difference of 0.010%), and Paiute (96.8%, a difference of 0.010%).
| Demographics | Rating | Rank | 6th Grade |
| Laotians | 11.8 /100 | #206 | Poor 96.8% |
| Iraqis | 11.7 /100 | #207 | Poor 96.8% |
| Samoans | 11.0 /100 | #208 | Poor 96.8% |
| Immigrants | Oceania | 11.0 /100 | #209 | Poor 96.8% |
| Immigrants | Nepal | 10.1 /100 | #210 | Poor 96.8% |
| Immigrants | Iraq | 9.2 /100 | #211 | Tragic 96.8% |
| Moroccans | 9.0 /100 | #212 | Tragic 96.8% |
| Immigrants | Sudan | 8.7 /100 | #213 | Tragic 96.8% |
| Portuguese | 8.2 /100 | #214 | Tragic 96.8% |
| Sierra Leoneans | 8.0 /100 | #215 | Tragic 96.8% |
| Paiute | 7.8 /100 | #216 | Tragic 96.8% |
| Liberians | 7.5 /100 | #217 | Tragic 96.8% |
| Navajo | 7.3 /100 | #218 | Tragic 96.8% |
| Costa Ricans | 6.8 /100 | #219 | Tragic 96.8% |
| Immigrants | Morocco | 6.2 /100 | #220 | Tragic 96.7% |
Demographics Similar to Blacks/African Americans by 6th Grade
In terms of 6th grade, the demographic groups most similar to Blacks/African Americans are Guamanian/Chamorro (97.0%, a difference of 0.0%), Immigrants from Argentina (97.0%, a difference of 0.0%), Argentinean (97.0%, a difference of 0.010%), Immigrants from Egypt (97.0%, a difference of 0.010%), and Dutch West Indian (96.9%, a difference of 0.010%).
| Demographics | Rating | Rank | 6th Grade |
| Immigrants | Ukraine | 35.6 /100 | #182 | Fair 97.0% |
| Immigrants | Venezuela | 34.5 /100 | #183 | Fair 97.0% |
| Spanish Americans | 33.5 /100 | #184 | Fair 97.0% |
| Argentineans | 33.0 /100 | #185 | Fair 97.0% |
| Immigrants | Egypt | 31.4 /100 | #186 | Fair 97.0% |
| Guamanians/Chamorros | 30.6 /100 | #187 | Fair 97.0% |
| Immigrants | Argentina | 30.4 /100 | #188 | Fair 97.0% |
| Blacks/African Americans | 30.2 /100 | #189 | Fair 97.0% |
| Dutch West Indians | 28.3 /100 | #190 | Fair 96.9% |
| Panamanians | 27.3 /100 | #191 | Fair 96.9% |
| Hawaiians | 27.0 /100 | #192 | Fair 96.9% |
| Paraguayans | 26.6 /100 | #193 | Fair 96.9% |
| Immigrants | Lebanon | 25.6 /100 | #194 | Fair 96.9% |
| Immigrants | Brazil | 25.5 /100 | #195 | Fair 96.9% |
| Immigrants | Uganda | 21.2 /100 | #196 | Fair 96.9% |