Immigrants from Sudan vs Immigrants from Fiji Seniors Poverty Over the Age of 75
COMPARE
Immigrants from Sudan
Immigrants from Fiji
Seniors Poverty Over the Age of 75
Seniors Poverty Over the Age of 75 Comparison
Immigrants from Sudan
Immigrants from Fiji
12.1%
SENIORS POVERTY OVER THE AGE OF 75
61.7/ 100
METRIC RATING
157th/ 347
METRIC RANK
12.2%
SENIORS POVERTY OVER THE AGE OF 75
51.5/ 100
METRIC RATING
172nd/ 347
METRIC RANK
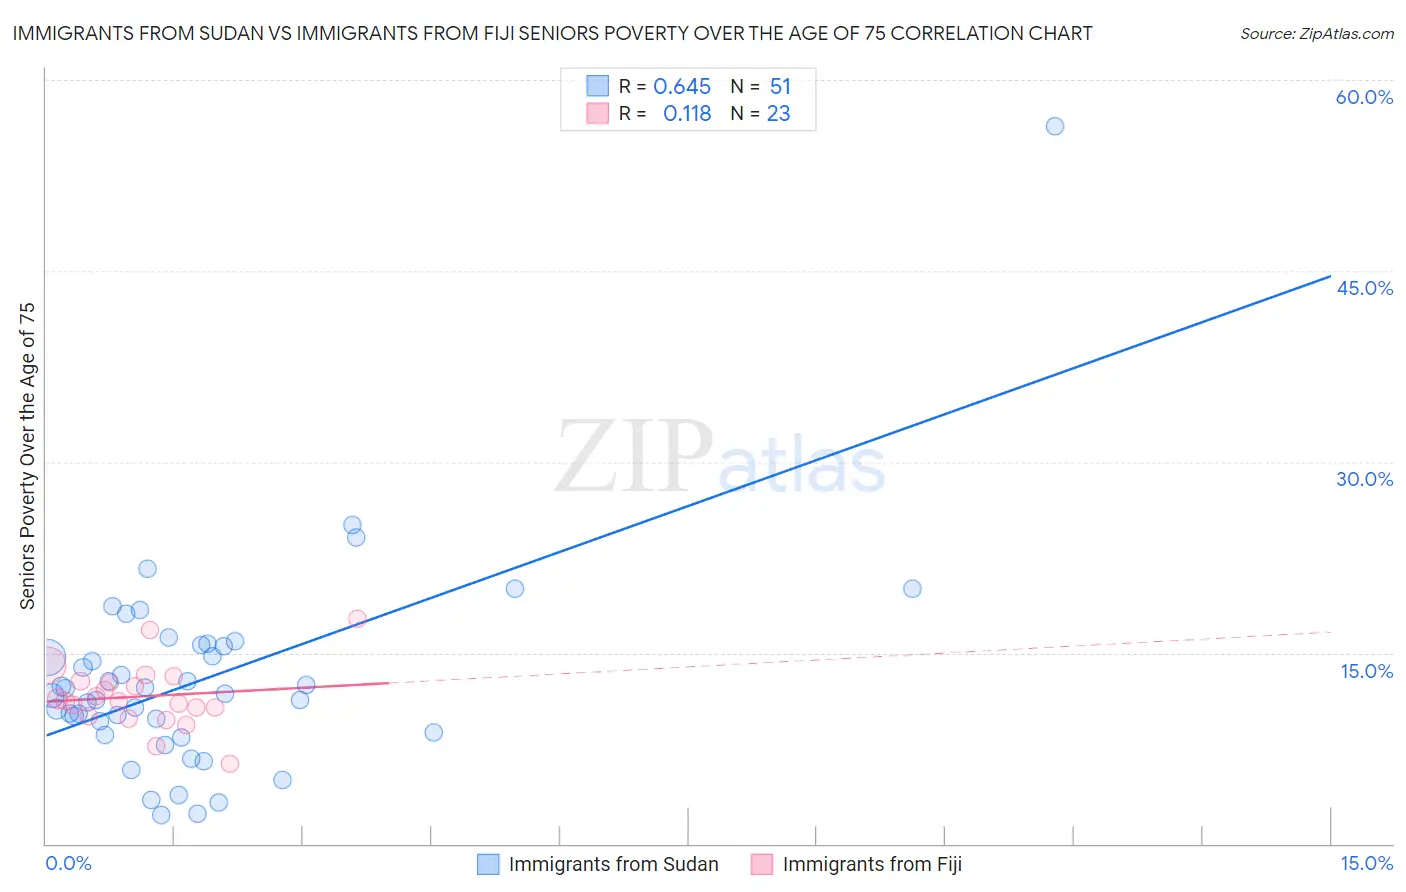
Immigrants from Sudan vs Immigrants from Fiji Seniors Poverty Over the Age of 75 Correlation Chart
The statistical analysis conducted on geographies consisting of 118,554,808 people shows a significant positive correlation between the proportion of Immigrants from Sudan and poverty level among seniors over the age of 75 in the United States with a correlation coefficient (R) of 0.645 and weighted average of 12.1%. Similarly, the statistical analysis conducted on geographies consisting of 93,526,881 people shows a poor positive correlation between the proportion of Immigrants from Fiji and poverty level among seniors over the age of 75 in the United States with a correlation coefficient (R) of 0.118 and weighted average of 12.2%, a difference of 0.85%.
Seniors Poverty Over the Age of 75 Correlation Summary
| Measurement | Immigrants from Sudan | Immigrants from Fiji |
| Minimum | 2.2% | 6.3% |
| Maximum | 56.4% | 17.7% |
| Range | 54.2% | 11.4% |
| Mean | 12.9% | 11.6% |
| Median | 11.8% | 11.2% |
| Interquartile 25% (IQ1) | 8.7% | 10.0% |
| Interquartile 75% (IQ3) | 15.6% | 12.8% |
| Interquartile Range (IQR) | 6.9% | 2.8% |
| Standard Deviation (Sample) | 8.2% | 2.5% |
| Standard Deviation (Population) | 8.1% | 2.5% |
Demographics Similar to Immigrants from Sudan and Immigrants from Fiji by Seniors Poverty Over the Age of 75
In terms of seniors poverty over the age of 75, the demographic groups most similar to Immigrants from Sudan are Portuguese (12.1%, a difference of 0.040%), Immigrants from Middle Africa (12.1%, a difference of 0.040%), Immigrants from Burma/Myanmar (12.1%, a difference of 0.060%), Immigrants from Eastern Africa (12.1%, a difference of 0.070%), and Indonesian (12.1%, a difference of 0.080%). Similarly, the demographic groups most similar to Immigrants from Fiji are Spaniard (12.2%, a difference of 0.010%), Immigrants from Thailand (12.2%, a difference of 0.040%), Arab (12.2%, a difference of 0.080%), Immigrants from Europe (12.2%, a difference of 0.12%), and Immigrants from Egypt (12.2%, a difference of 0.18%).
| Demographics | Rating | Rank | Seniors Poverty Over the Age of 75 |
| Cambodians | 64.0 /100 | #154 | Good 12.0% |
| Indonesians | 62.6 /100 | #155 | Good 12.1% |
| Immigrants | Burma/Myanmar | 62.3 /100 | #156 | Good 12.1% |
| Immigrants | Sudan | 61.7 /100 | #157 | Good 12.1% |
| Portuguese | 61.3 /100 | #158 | Good 12.1% |
| Immigrants | Middle Africa | 61.2 /100 | #159 | Good 12.1% |
| Immigrants | Eastern Africa | 60.9 /100 | #160 | Good 12.1% |
| Immigrants | Norway | 60.6 /100 | #161 | Good 12.1% |
| Immigrants | Serbia | 60.2 /100 | #162 | Good 12.1% |
| Immigrants | Greece | 58.2 /100 | #163 | Average 12.1% |
| Potawatomi | 57.4 /100 | #164 | Average 12.1% |
| Okinawans | 56.3 /100 | #165 | Average 12.1% |
| Egyptians | 54.8 /100 | #166 | Average 12.1% |
| Immigrants | Switzerland | 54.5 /100 | #167 | Average 12.1% |
| Immigrants | Syria | 53.9 /100 | #168 | Average 12.2% |
| Immigrants | Egypt | 53.7 /100 | #169 | Average 12.2% |
| Immigrants | Thailand | 52.0 /100 | #170 | Average 12.2% |
| Spaniards | 51.6 /100 | #171 | Average 12.2% |
| Immigrants | Fiji | 51.5 /100 | #172 | Average 12.2% |
| Arabs | 50.5 /100 | #173 | Average 12.2% |
| Immigrants | Europe | 50.0 /100 | #174 | Average 12.2% |