Immigrants from St. Vincent and the Grenadines vs French Canadian Poverty
COMPARE
Immigrants from St. Vincent and the Grenadines
French Canadian
Poverty
Poverty Comparison
Immigrants from St. Vincent and the Grenadines
French Canadians
14.9%
POVERTY
0.0/ 100
METRIC RATING
279th/ 347
METRIC RANK
11.6%
POVERTY
91.0/ 100
METRIC RATING
111th/ 347
METRIC RANK
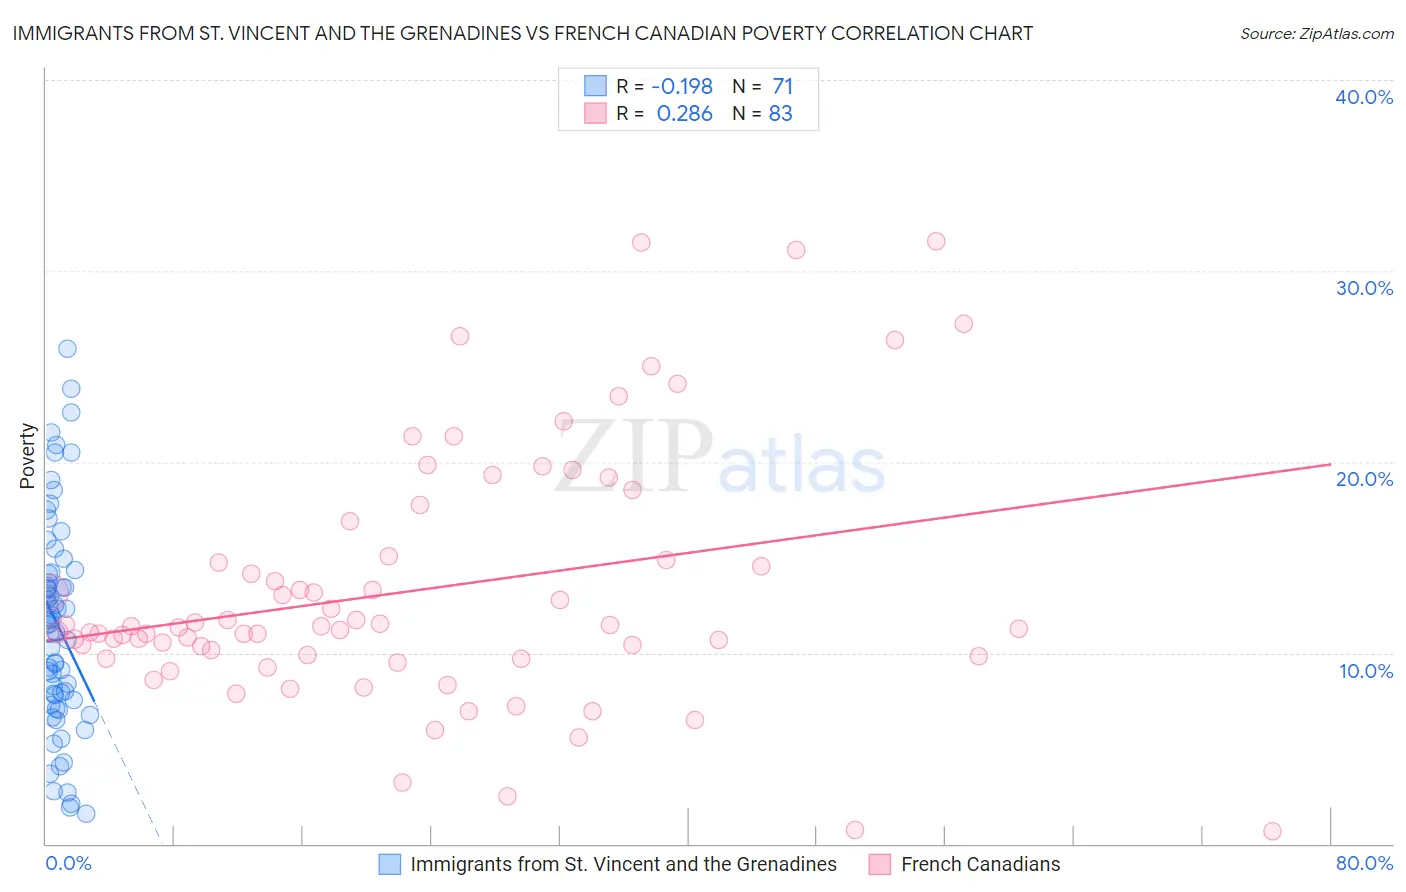
Immigrants from St. Vincent and the Grenadines vs French Canadian Poverty Correlation Chart
The statistical analysis conducted on geographies consisting of 56,091,353 people shows a poor negative correlation between the proportion of Immigrants from St. Vincent and the Grenadines and poverty level in the United States with a correlation coefficient (R) of -0.198 and weighted average of 14.9%. Similarly, the statistical analysis conducted on geographies consisting of 502,211,905 people shows a weak positive correlation between the proportion of French Canadians and poverty level in the United States with a correlation coefficient (R) of 0.286 and weighted average of 11.6%, a difference of 27.9%.
Poverty Correlation Summary
| Measurement | Immigrants from St. Vincent and the Grenadines | French Canadian |
| Minimum | 1.6% | 0.65% |
| Maximum | 25.9% | 31.6% |
| Range | 24.3% | 30.9% |
| Mean | 11.5% | 13.3% |
| Median | 11.5% | 11.3% |
| Interquartile 25% (IQ1) | 7.5% | 9.8% |
| Interquartile 75% (IQ3) | 14.2% | 15.1% |
| Interquartile Range (IQR) | 6.7% | 5.3% |
| Standard Deviation (Sample) | 5.5% | 6.6% |
| Standard Deviation (Population) | 5.5% | 6.5% |
Similar Demographics by Poverty
Demographics Similar to Immigrants from St. Vincent and the Grenadines by Poverty
In terms of poverty, the demographic groups most similar to Immigrants from St. Vincent and the Grenadines are Haitian (14.9%, a difference of 0.20%), Immigrants from Barbados (14.9%, a difference of 0.27%), Belizean (14.8%, a difference of 0.29%), Bangladeshi (14.8%, a difference of 0.31%), and Immigrants from West Indies (14.8%, a difference of 0.37%).
| Demographics | Rating | Rank | Poverty |
| Chickasaw | 0.0 /100 | #272 | Tragic 14.7% |
| Spanish Americans | 0.0 /100 | #273 | Tragic 14.7% |
| Barbadians | 0.0 /100 | #274 | Tragic 14.8% |
| Immigrants | West Indies | 0.0 /100 | #275 | Tragic 14.8% |
| Immigrants | Bahamas | 0.0 /100 | #276 | Tragic 14.8% |
| Bangladeshis | 0.0 /100 | #277 | Tragic 14.8% |
| Belizeans | 0.0 /100 | #278 | Tragic 14.8% |
| Immigrants | St. Vincent and the Grenadines | 0.0 /100 | #279 | Tragic 14.9% |
| Haitians | 0.0 /100 | #280 | Tragic 14.9% |
| Immigrants | Barbados | 0.0 /100 | #281 | Tragic 14.9% |
| Comanche | 0.0 /100 | #282 | Tragic 15.0% |
| Immigrants | Haiti | 0.0 /100 | #283 | Tragic 15.0% |
| West Indians | 0.0 /100 | #284 | Tragic 15.0% |
| Vietnamese | 0.0 /100 | #285 | Tragic 15.0% |
| Immigrants | Latin America | 0.0 /100 | #286 | Tragic 15.0% |
Demographics Similar to French Canadians by Poverty
In terms of poverty, the demographic groups most similar to French Canadians are Immigrants from Southern Europe (11.6%, a difference of 0.070%), Immigrants from Belarus (11.6%, a difference of 0.070%), Immigrants from China (11.6%, a difference of 0.090%), Welsh (11.6%, a difference of 0.17%), and Immigrants from Turkey (11.6%, a difference of 0.21%).
| Demographics | Rating | Rank | Poverty |
| Native Hawaiians | 92.1 /100 | #104 | Exceptional 11.6% |
| Portuguese | 92.1 /100 | #105 | Exceptional 11.6% |
| Immigrants | Zimbabwe | 92.1 /100 | #106 | Exceptional 11.6% |
| Palestinians | 91.8 /100 | #107 | Exceptional 11.6% |
| Canadians | 91.7 /100 | #108 | Exceptional 11.6% |
| Immigrants | Turkey | 91.7 /100 | #109 | Exceptional 11.6% |
| Welsh | 91.6 /100 | #110 | Exceptional 11.6% |
| French Canadians | 91.0 /100 | #111 | Exceptional 11.6% |
| Immigrants | Southern Europe | 90.8 /100 | #112 | Exceptional 11.6% |
| Immigrants | Belarus | 90.8 /100 | #113 | Exceptional 11.6% |
| Immigrants | China | 90.7 /100 | #114 | Exceptional 11.6% |
| Albanians | 90.3 /100 | #115 | Exceptional 11.7% |
| Immigrants | Russia | 89.7 /100 | #116 | Excellent 11.7% |
| Sri Lankans | 89.4 /100 | #117 | Excellent 11.7% |
| Argentineans | 89.1 /100 | #118 | Excellent 11.7% |