Immigrants from Sri Lanka vs Spanish Poverty
COMPARE
Immigrants from Sri Lanka
Spanish
Poverty
Poverty Comparison
Immigrants from Sri Lanka
Spanish
11.2%
POVERTY
97.9/ 100
METRIC RATING
60th/ 347
METRIC RANK
12.8%
POVERTY
18.7/ 100
METRIC RATING
198th/ 347
METRIC RANK
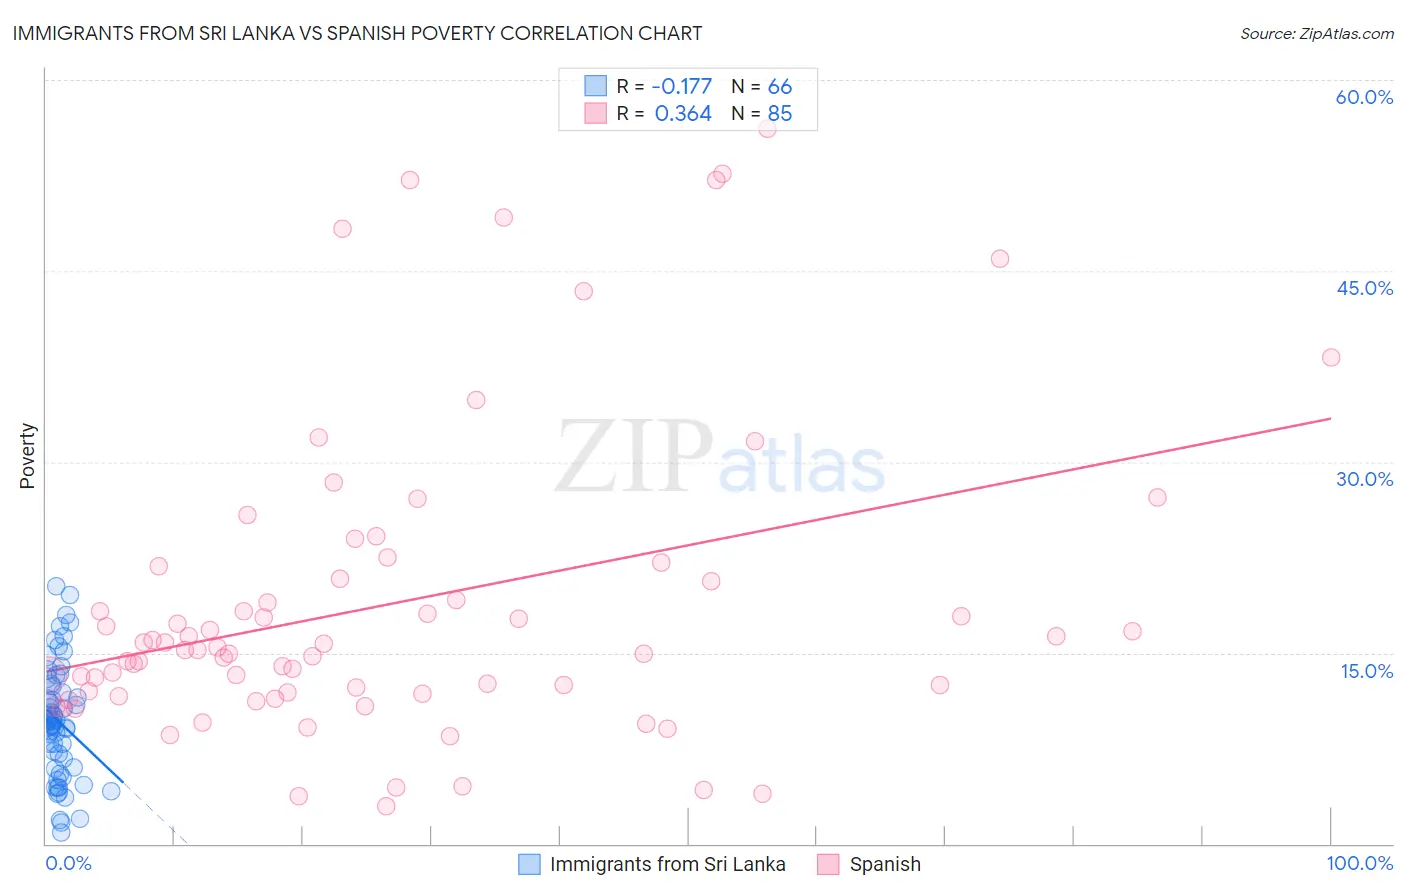
Immigrants from Sri Lanka vs Spanish Poverty Correlation Chart
The statistical analysis conducted on geographies consisting of 149,683,532 people shows a poor negative correlation between the proportion of Immigrants from Sri Lanka and poverty level in the United States with a correlation coefficient (R) of -0.177 and weighted average of 11.2%. Similarly, the statistical analysis conducted on geographies consisting of 421,940,954 people shows a mild positive correlation between the proportion of Spanish and poverty level in the United States with a correlation coefficient (R) of 0.364 and weighted average of 12.8%, a difference of 14.2%.
Poverty Correlation Summary
| Measurement | Immigrants from Sri Lanka | Spanish |
| Minimum | 0.89% | 3.0% |
| Maximum | 20.2% | 56.1% |
| Range | 19.3% | 53.2% |
| Mean | 9.6% | 18.9% |
| Median | 9.6% | 15.2% |
| Interquartile 25% (IQ1) | 6.0% | 11.8% |
| Interquartile 75% (IQ3) | 12.4% | 21.3% |
| Interquartile Range (IQR) | 6.4% | 9.5% |
| Standard Deviation (Sample) | 4.5% | 12.1% |
| Standard Deviation (Population) | 4.4% | 12.1% |
Similar Demographics by Poverty
Demographics Similar to Immigrants from Sri Lanka by Poverty
In terms of poverty, the demographic groups most similar to Immigrants from Sri Lanka are Immigrants from Italy (11.2%, a difference of 0.060%), Austrian (11.2%, a difference of 0.10%), Ukrainian (11.2%, a difference of 0.10%), Immigrants from Europe (11.2%, a difference of 0.16%), and German (11.1%, a difference of 0.31%).
| Demographics | Rating | Rank | Poverty |
| Immigrants | Austria | 98.6 /100 | #53 | Exceptional 11.1% |
| Immigrants | Bulgaria | 98.5 /100 | #54 | Exceptional 11.1% |
| Immigrants | Serbia | 98.5 /100 | #55 | Exceptional 11.1% |
| Estonians | 98.2 /100 | #56 | Exceptional 11.1% |
| Scandinavians | 98.2 /100 | #57 | Exceptional 11.1% |
| Germans | 98.1 /100 | #58 | Exceptional 11.1% |
| Immigrants | Europe | 98.0 /100 | #59 | Exceptional 11.2% |
| Immigrants | Sri Lanka | 97.9 /100 | #60 | Exceptional 11.2% |
| Immigrants | Italy | 97.9 /100 | #61 | Exceptional 11.2% |
| Austrians | 97.8 /100 | #62 | Exceptional 11.2% |
| Ukrainians | 97.8 /100 | #63 | Exceptional 11.2% |
| Swiss | 97.7 /100 | #64 | Exceptional 11.2% |
| Immigrants | Asia | 97.5 /100 | #65 | Exceptional 11.2% |
| Immigrants | Netherlands | 97.5 /100 | #66 | Exceptional 11.2% |
| Immigrants | Australia | 97.4 /100 | #67 | Exceptional 11.2% |
Demographics Similar to Spanish by Poverty
In terms of poverty, the demographic groups most similar to Spanish are Immigrants from Lebanon (12.8%, a difference of 0.010%), Immigrants from Kenya (12.8%, a difference of 0.19%), Iraqi (12.7%, a difference of 0.31%), Immigrants from Kuwait (12.7%, a difference of 0.33%), and Spaniard (12.8%, a difference of 0.35%).
| Demographics | Rating | Rank | Poverty |
| Sierra Leoneans | 31.5 /100 | #191 | Fair 12.6% |
| South American Indians | 23.3 /100 | #192 | Fair 12.7% |
| Delaware | 21.4 /100 | #193 | Fair 12.7% |
| Arabs | 21.1 /100 | #194 | Fair 12.7% |
| Immigrants | Kuwait | 20.9 /100 | #195 | Fair 12.7% |
| Iraqis | 20.8 /100 | #196 | Fair 12.7% |
| Immigrants | Lebanon | 18.7 /100 | #197 | Poor 12.8% |
| Spanish | 18.7 /100 | #198 | Poor 12.8% |
| Immigrants | Kenya | 17.5 /100 | #199 | Poor 12.8% |
| Spaniards | 16.5 /100 | #200 | Poor 12.8% |
| Immigrants | Uganda | 16.5 /100 | #201 | Poor 12.8% |
| Immigrants | Uruguay | 15.6 /100 | #202 | Poor 12.8% |
| Hmong | 15.0 /100 | #203 | Poor 12.8% |
| Immigrants | Western Asia | 14.1 /100 | #204 | Poor 12.9% |
| Tsimshian | 9.2 /100 | #205 | Tragic 13.0% |