Immigrants from Sri Lanka vs Immigrants from Iran Poverty
COMPARE
Immigrants from Sri Lanka
Immigrants from Iran
Poverty
Poverty Comparison
Immigrants from Sri Lanka
Immigrants from Iran
11.2%
POVERTY
97.9/ 100
METRIC RATING
60th/ 347
METRIC RANK
10.9%
POVERTY
99.2/ 100
METRIC RATING
41st/ 347
METRIC RANK
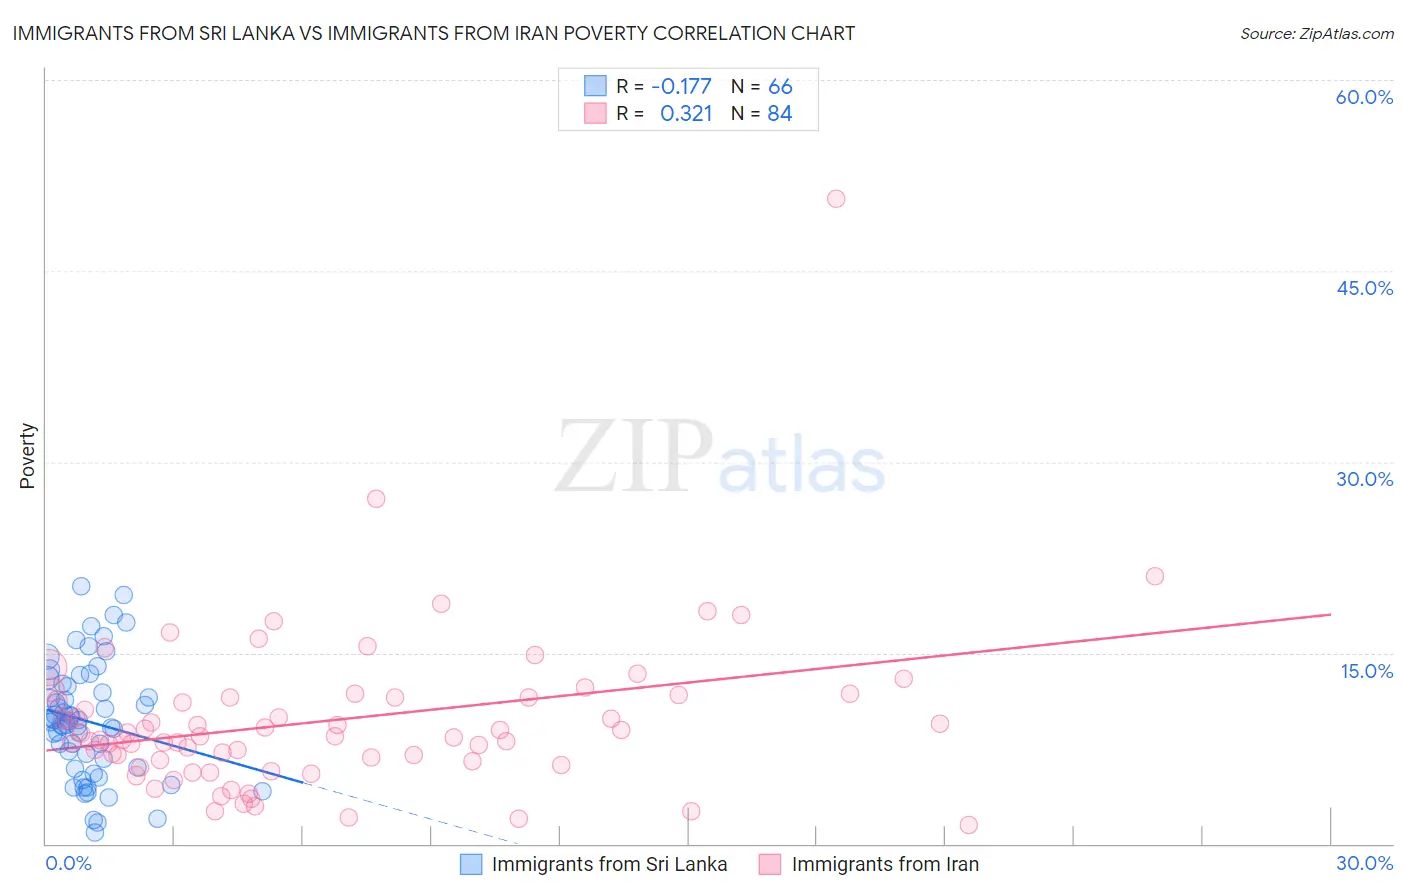
Immigrants from Sri Lanka vs Immigrants from Iran Poverty Correlation Chart
The statistical analysis conducted on geographies consisting of 149,683,532 people shows a poor negative correlation between the proportion of Immigrants from Sri Lanka and poverty level in the United States with a correlation coefficient (R) of -0.177 and weighted average of 11.2%. Similarly, the statistical analysis conducted on geographies consisting of 279,844,732 people shows a mild positive correlation between the proportion of Immigrants from Iran and poverty level in the United States with a correlation coefficient (R) of 0.321 and weighted average of 10.9%, a difference of 2.8%.
Poverty Correlation Summary
| Measurement | Immigrants from Sri Lanka | Immigrants from Iran |
| Minimum | 0.89% | 1.5% |
| Maximum | 20.2% | 50.6% |
| Range | 19.3% | 49.1% |
| Mean | 9.6% | 9.7% |
| Median | 9.6% | 8.4% |
| Interquartile 25% (IQ1) | 6.0% | 6.5% |
| Interquartile 75% (IQ3) | 12.4% | 11.5% |
| Interquartile Range (IQR) | 6.4% | 5.0% |
| Standard Deviation (Sample) | 4.5% | 6.4% |
| Standard Deviation (Population) | 4.4% | 6.4% |
Demographics Similar to Immigrants from Sri Lanka and Immigrants from Iran by Poverty
In terms of poverty, the demographic groups most similar to Immigrants from Sri Lanka are Immigrants from Europe (11.2%, a difference of 0.16%), German (11.1%, a difference of 0.31%), Scandinavian (11.1%, a difference of 0.37%), Estonian (11.1%, a difference of 0.42%), and Immigrants from Serbia (11.1%, a difference of 0.90%). Similarly, the demographic groups most similar to Immigrants from Iran are Russian (10.9%, a difference of 0.090%), Korean (10.9%, a difference of 0.22%), Immigrants from Singapore (10.9%, a difference of 0.27%), Immigrants from Moldova (10.9%, a difference of 0.41%), and Turkish (11.0%, a difference of 0.92%).
| Demographics | Rating | Rank | Poverty |
| Russians | 99.3 /100 | #40 | Exceptional 10.9% |
| Immigrants | Iran | 99.2 /100 | #41 | Exceptional 10.9% |
| Koreans | 99.2 /100 | #42 | Exceptional 10.9% |
| Immigrants | Singapore | 99.2 /100 | #43 | Exceptional 10.9% |
| Immigrants | Moldova | 99.1 /100 | #44 | Exceptional 10.9% |
| Turks | 98.9 /100 | #45 | Exceptional 11.0% |
| Immigrants | Czechoslovakia | 98.9 /100 | #46 | Exceptional 11.0% |
| Immigrants | Romania | 98.9 /100 | #47 | Exceptional 11.0% |
| Slovenes | 98.9 /100 | #48 | Exceptional 11.0% |
| Immigrants | Japan | 98.9 /100 | #49 | Exceptional 11.0% |
| Asians | 98.9 /100 | #50 | Exceptional 11.0% |
| Immigrants | Croatia | 98.7 /100 | #51 | Exceptional 11.0% |
| Immigrants | Philippines | 98.7 /100 | #52 | Exceptional 11.0% |
| Immigrants | Austria | 98.6 /100 | #53 | Exceptional 11.1% |
| Immigrants | Bulgaria | 98.5 /100 | #54 | Exceptional 11.1% |
| Immigrants | Serbia | 98.5 /100 | #55 | Exceptional 11.1% |
| Estonians | 98.2 /100 | #56 | Exceptional 11.1% |
| Scandinavians | 98.2 /100 | #57 | Exceptional 11.1% |
| Germans | 98.1 /100 | #58 | Exceptional 11.1% |
| Immigrants | Europe | 98.0 /100 | #59 | Exceptional 11.2% |
| Immigrants | Sri Lanka | 97.9 /100 | #60 | Exceptional 11.2% |