Immigrants from Spain vs Immigrants from Fiji Family Poverty
COMPARE
Immigrants from Spain
Immigrants from Fiji
Family Poverty
Family Poverty Comparison
Immigrants from Spain
Immigrants from Fiji
8.6%
FAMILY POVERTY
79.1/ 100
METRIC RATING
153rd/ 347
METRIC RANK
8.9%
FAMILY POVERTY
56.4/ 100
METRIC RATING
173rd/ 347
METRIC RANK
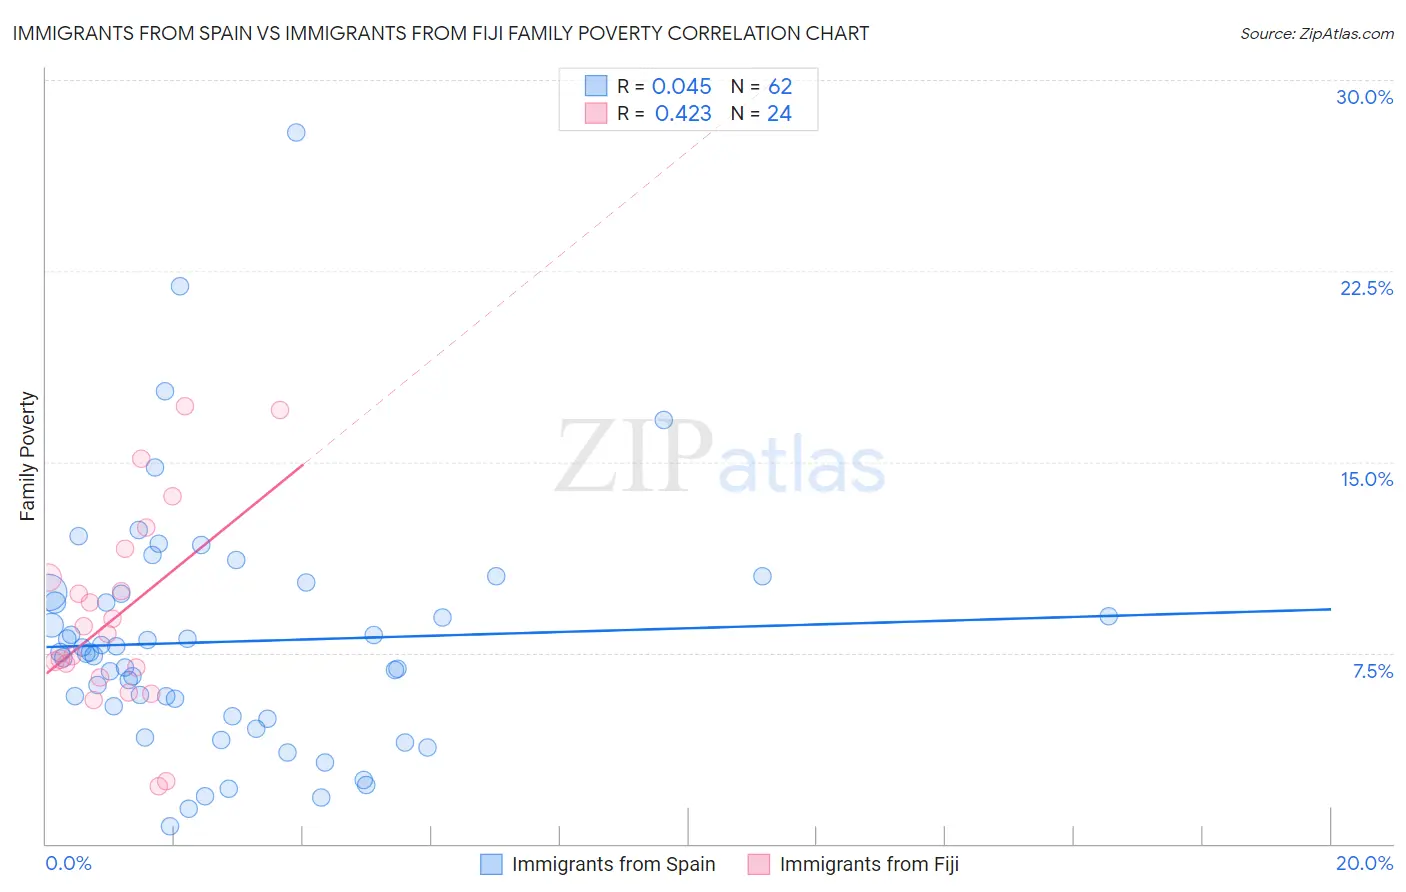
Immigrants from Spain vs Immigrants from Fiji Family Poverty Correlation Chart
The statistical analysis conducted on geographies consisting of 239,325,125 people shows no correlation between the proportion of Immigrants from Spain and poverty level among families in the United States with a correlation coefficient (R) of 0.045 and weighted average of 8.6%. Similarly, the statistical analysis conducted on geographies consisting of 93,742,503 people shows a moderate positive correlation between the proportion of Immigrants from Fiji and poverty level among families in the United States with a correlation coefficient (R) of 0.423 and weighted average of 8.9%, a difference of 3.7%.
Family Poverty Correlation Summary
| Measurement | Immigrants from Spain | Immigrants from Fiji |
| Minimum | 0.68% | 2.3% |
| Maximum | 27.9% | 17.2% |
| Range | 27.3% | 14.9% |
| Mean | 7.9% | 9.0% |
| Median | 7.5% | 8.4% |
| Interquartile 25% (IQ1) | 5.0% | 6.7% |
| Interquartile 75% (IQ3) | 9.8% | 11.0% |
| Interquartile Range (IQR) | 4.8% | 4.3% |
| Standard Deviation (Sample) | 4.7% | 3.9% |
| Standard Deviation (Population) | 4.7% | 3.8% |
Demographics Similar to Immigrants from Spain and Immigrants from Fiji by Family Poverty
In terms of family poverty, the demographic groups most similar to Immigrants from Spain are Immigrants from Vietnam (8.7%, a difference of 0.72%), Immigrants from Kuwait (8.7%, a difference of 1.1%), Immigrants from Oceania (8.7%, a difference of 1.5%), Tsimshian (8.8%, a difference of 1.8%), and White/Caucasian (8.8%, a difference of 1.8%). Similarly, the demographic groups most similar to Immigrants from Fiji are Immigrants from Peru (8.9%, a difference of 0.15%), Lebanese (8.9%, a difference of 0.16%), Kenyan (8.9%, a difference of 0.25%), Immigrants from Chile (8.9%, a difference of 0.44%), and Israeli (8.9%, a difference of 0.79%).
| Demographics | Rating | Rank | Family Poverty |
| Immigrants | Spain | 79.1 /100 | #153 | Good 8.6% |
| Immigrants | Vietnam | 75.4 /100 | #154 | Good 8.7% |
| Immigrants | Kuwait | 73.6 /100 | #155 | Good 8.7% |
| Immigrants | Oceania | 71.2 /100 | #156 | Good 8.7% |
| Tsimshian | 69.3 /100 | #157 | Good 8.8% |
| Whites/Caucasians | 69.1 /100 | #158 | Good 8.8% |
| Peruvians | 68.0 /100 | #159 | Good 8.8% |
| Hungarians | 67.2 /100 | #160 | Good 8.8% |
| Immigrants | Northern Africa | 66.9 /100 | #161 | Good 8.8% |
| Ethiopians | 66.3 /100 | #162 | Good 8.8% |
| Pennsylvania Germans | 66.0 /100 | #163 | Good 8.8% |
| Celtics | 64.9 /100 | #164 | Good 8.8% |
| Guamanians/Chamorros | 64.7 /100 | #165 | Good 8.8% |
| Afghans | 63.5 /100 | #166 | Good 8.8% |
| Immigrants | Ethiopia | 62.5 /100 | #167 | Good 8.9% |
| Israelis | 62.1 /100 | #168 | Good 8.9% |
| Immigrants | Chile | 59.6 /100 | #169 | Average 8.9% |
| Kenyans | 58.2 /100 | #170 | Average 8.9% |
| Lebanese | 57.6 /100 | #171 | Average 8.9% |
| Immigrants | Peru | 57.5 /100 | #172 | Average 8.9% |
| Immigrants | Fiji | 56.4 /100 | #173 | Average 8.9% |