Danish vs Immigrants from Fiji Family Poverty
COMPARE
Danish
Immigrants from Fiji
Family Poverty
Family Poverty Comparison
Danes
Immigrants from Fiji
7.3%
FAMILY POVERTY
99.7/ 100
METRIC RATING
22nd/ 347
METRIC RANK
8.9%
FAMILY POVERTY
56.4/ 100
METRIC RATING
173rd/ 347
METRIC RANK
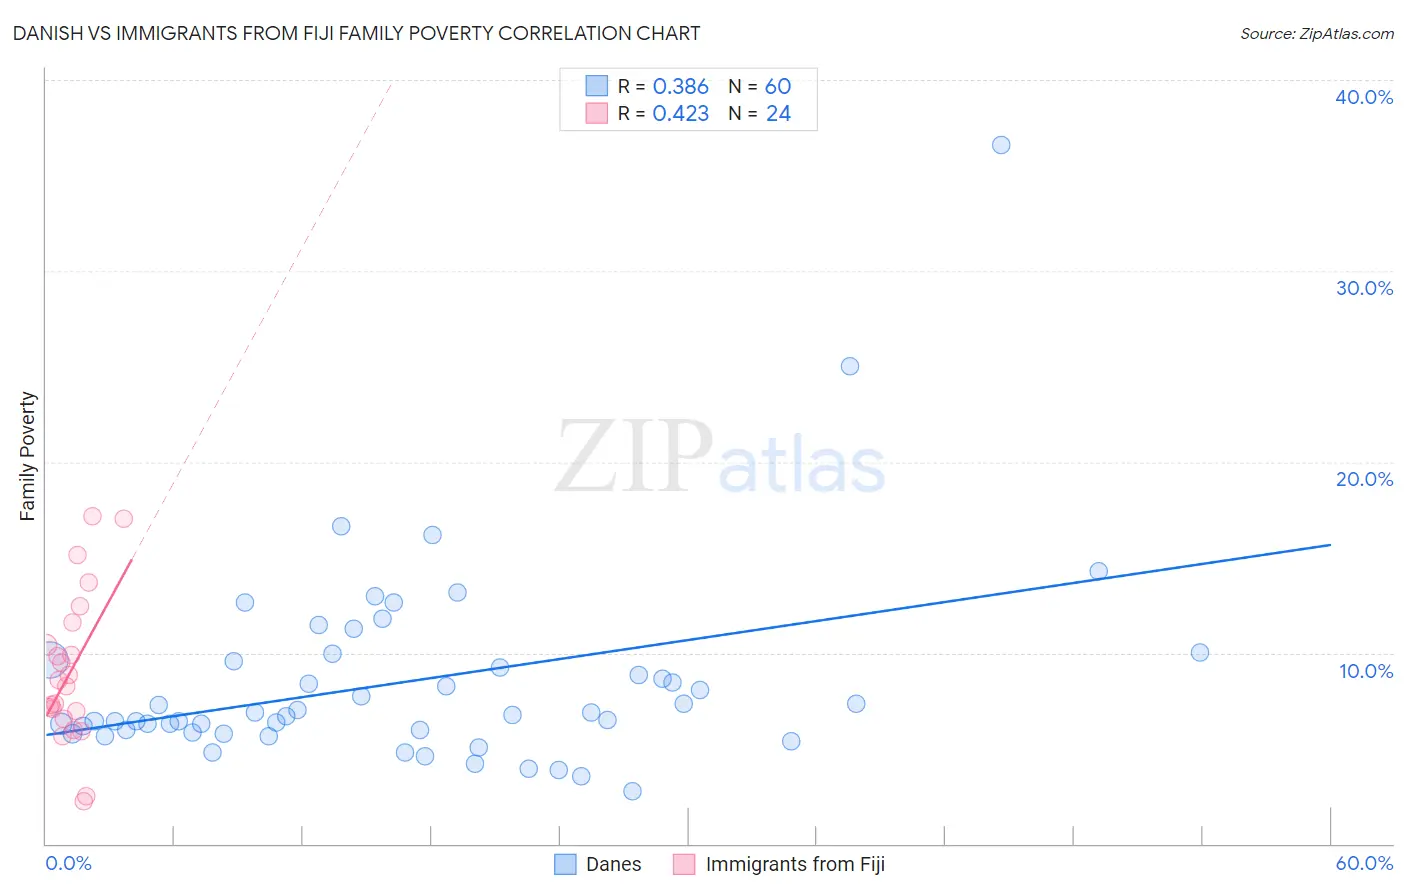
Danish vs Immigrants from Fiji Family Poverty Correlation Chart
The statistical analysis conducted on geographies consisting of 471,902,124 people shows a mild positive correlation between the proportion of Danes and poverty level among families in the United States with a correlation coefficient (R) of 0.386 and weighted average of 7.3%. Similarly, the statistical analysis conducted on geographies consisting of 93,742,503 people shows a moderate positive correlation between the proportion of Immigrants from Fiji and poverty level among families in the United States with a correlation coefficient (R) of 0.423 and weighted average of 8.9%, a difference of 22.3%.
Family Poverty Correlation Summary
| Measurement | Danish | Immigrants from Fiji |
| Minimum | 2.7% | 2.3% |
| Maximum | 36.6% | 17.2% |
| Range | 33.8% | 14.9% |
| Mean | 8.5% | 9.0% |
| Median | 6.8% | 8.4% |
| Interquartile 25% (IQ1) | 5.9% | 6.7% |
| Interquartile 75% (IQ3) | 9.6% | 11.0% |
| Interquartile Range (IQR) | 3.7% | 4.3% |
| Standard Deviation (Sample) | 5.3% | 3.9% |
| Standard Deviation (Population) | 5.2% | 3.8% |
Similar Demographics by Family Poverty
Demographics Similar to Danes by Family Poverty
In terms of family poverty, the demographic groups most similar to Danes are Assyrian/Chaldean/Syriac (7.3%, a difference of 0.010%), Croatian (7.3%, a difference of 0.31%), Burmese (7.3%, a difference of 0.32%), Immigrants from Iran (7.3%, a difference of 0.44%), and Cypriot (7.3%, a difference of 0.56%).
| Demographics | Rating | Rank | Family Poverty |
| Lithuanians | 99.8 /100 | #15 | Exceptional 7.2% |
| Immigrants | South Central Asia | 99.8 /100 | #16 | Exceptional 7.2% |
| Luxembourgers | 99.8 /100 | #17 | Exceptional 7.2% |
| Immigrants | Lithuania | 99.8 /100 | #18 | Exceptional 7.2% |
| Eastern Europeans | 99.7 /100 | #19 | Exceptional 7.2% |
| Immigrants | Hong Kong | 99.7 /100 | #20 | Exceptional 7.3% |
| Immigrants | Iran | 99.7 /100 | #21 | Exceptional 7.3% |
| Danes | 99.7 /100 | #22 | Exceptional 7.3% |
| Assyrians/Chaldeans/Syriacs | 99.7 /100 | #23 | Exceptional 7.3% |
| Croatians | 99.7 /100 | #24 | Exceptional 7.3% |
| Burmese | 99.7 /100 | #25 | Exceptional 7.3% |
| Cypriots | 99.6 /100 | #26 | Exceptional 7.3% |
| Immigrants | Scotland | 99.6 /100 | #27 | Exceptional 7.3% |
| Immigrants | Korea | 99.6 /100 | #28 | Exceptional 7.4% |
| Immigrants | Northern Europe | 99.6 /100 | #29 | Exceptional 7.4% |
Demographics Similar to Immigrants from Fiji by Family Poverty
In terms of family poverty, the demographic groups most similar to Immigrants from Fiji are Immigrants from Peru (8.9%, a difference of 0.15%), Lebanese (8.9%, a difference of 0.16%), Kenyan (8.9%, a difference of 0.25%), Immigrants from Chile (8.9%, a difference of 0.44%), and Israeli (8.9%, a difference of 0.79%).
| Demographics | Rating | Rank | Family Poverty |
| Afghans | 63.5 /100 | #166 | Good 8.8% |
| Immigrants | Ethiopia | 62.5 /100 | #167 | Good 8.9% |
| Israelis | 62.1 /100 | #168 | Good 8.9% |
| Immigrants | Chile | 59.6 /100 | #169 | Average 8.9% |
| Kenyans | 58.2 /100 | #170 | Average 8.9% |
| Lebanese | 57.6 /100 | #171 | Average 8.9% |
| Immigrants | Peru | 57.5 /100 | #172 | Average 8.9% |
| Immigrants | Fiji | 56.4 /100 | #173 | Average 8.9% |
| Immigrants | Albania | 50.0 /100 | #174 | Average 9.0% |
| Costa Ricans | 49.3 /100 | #175 | Average 9.0% |
| Immigrants | Syria | 47.5 /100 | #176 | Average 9.0% |
| Hawaiians | 47.2 /100 | #177 | Average 9.0% |
| Immigrants | Cameroon | 47.1 /100 | #178 | Average 9.0% |
| Immigrants | Iraq | 44.4 /100 | #179 | Average 9.1% |
| Immigrants | Uganda | 43.4 /100 | #180 | Average 9.1% |