Immigrants from Southern Europe vs Immigrants from Kenya Female Disability
COMPARE
Immigrants from Southern Europe
Immigrants from Kenya
Female Disability
Female Disability Comparison
Immigrants from Southern Europe
Immigrants from Kenya
12.2%
FEMALE DISABILITY
56.3/ 100
METRIC RATING
171st/ 347
METRIC RANK
12.0%
FEMALE DISABILITY
83.1/ 100
METRIC RATING
148th/ 347
METRIC RANK
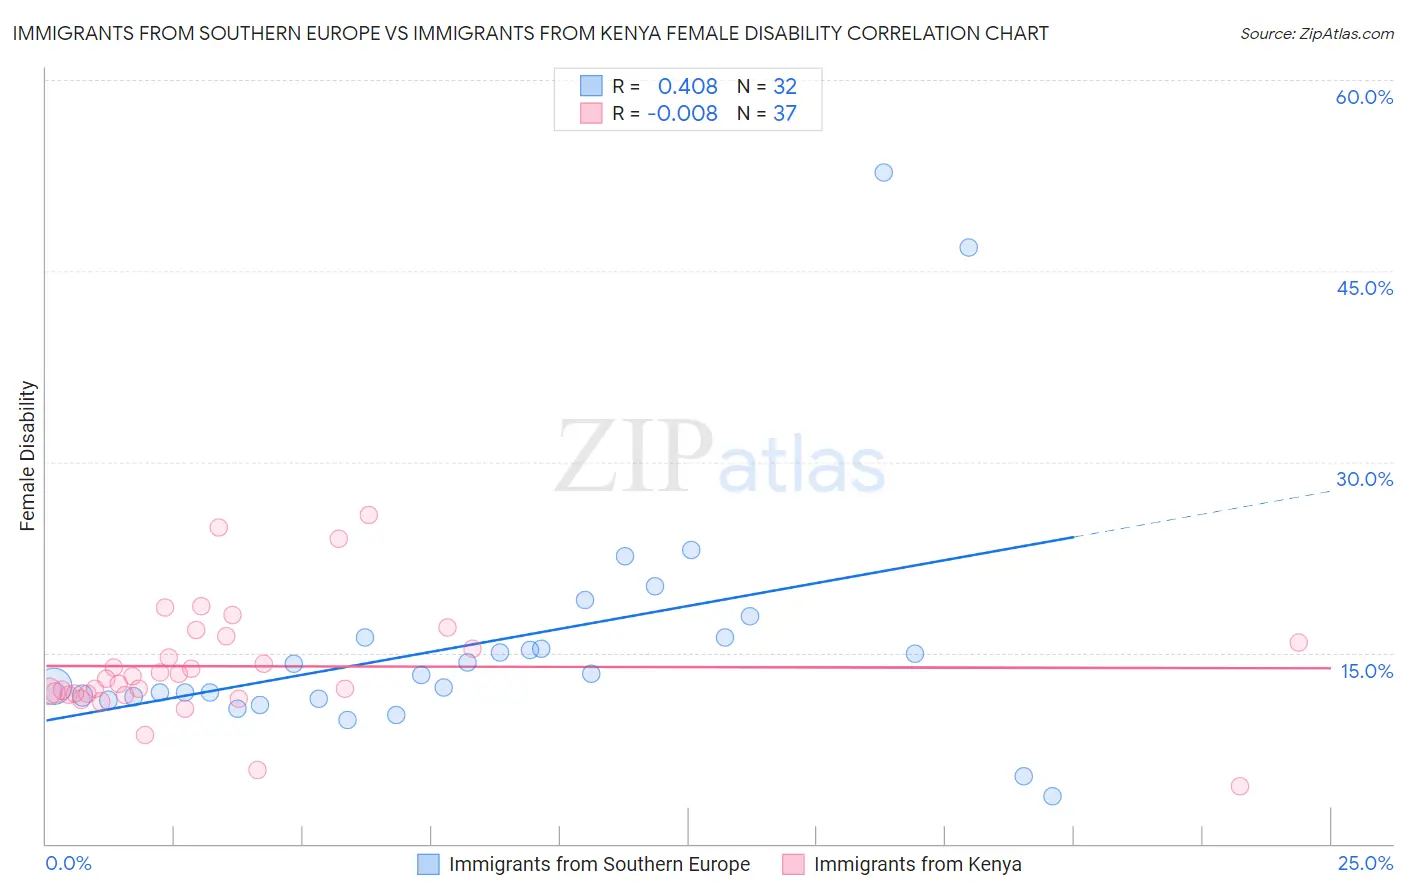
Immigrants from Southern Europe vs Immigrants from Kenya Female Disability Correlation Chart
The statistical analysis conducted on geographies consisting of 402,770,343 people shows a moderate positive correlation between the proportion of Immigrants from Southern Europe and percentage of females with a disability in the United States with a correlation coefficient (R) of 0.408 and weighted average of 12.2%. Similarly, the statistical analysis conducted on geographies consisting of 218,056,987 people shows no correlation between the proportion of Immigrants from Kenya and percentage of females with a disability in the United States with a correlation coefficient (R) of -0.008 and weighted average of 12.0%, a difference of 1.3%.
Female Disability Correlation Summary
| Measurement | Immigrants from Southern Europe | Immigrants from Kenya |
| Minimum | 3.7% | 4.5% |
| Maximum | 52.8% | 25.8% |
| Range | 49.1% | 21.2% |
| Mean | 15.8% | 13.9% |
| Median | 13.3% | 12.9% |
| Interquartile 25% (IQ1) | 11.5% | 11.7% |
| Interquartile 75% (IQ3) | 16.2% | 16.1% |
| Interquartile Range (IQR) | 4.7% | 4.3% |
| Standard Deviation (Sample) | 9.8% | 4.4% |
| Standard Deviation (Population) | 9.7% | 4.4% |
Similar Demographics by Female Disability
Demographics Similar to Immigrants from Southern Europe by Female Disability
In terms of female disability, the demographic groups most similar to Immigrants from Southern Europe are Maltese (12.2%, a difference of 0.030%), Lebanese (12.2%, a difference of 0.070%), Immigrants from Haiti (12.2%, a difference of 0.10%), Immigrants from Latin America (12.2%, a difference of 0.11%), and Lithuanian (12.2%, a difference of 0.12%).
| Demographics | Rating | Rank | Female Disability |
| Czechs | 63.6 /100 | #164 | Good 12.1% |
| Immigrants | Oceania | 61.8 /100 | #165 | Good 12.1% |
| Lithuanians | 59.5 /100 | #166 | Average 12.2% |
| Immigrants | Latin America | 59.0 /100 | #167 | Average 12.2% |
| Immigrants | Haiti | 58.8 /100 | #168 | Average 12.2% |
| Lebanese | 58.1 /100 | #169 | Average 12.2% |
| Maltese | 57.0 /100 | #170 | Average 12.2% |
| Immigrants | Southern Europe | 56.3 /100 | #171 | Average 12.2% |
| Haitians | 51.9 /100 | #172 | Average 12.2% |
| Immigrants | Mexico | 50.8 /100 | #173 | Average 12.2% |
| Immigrants | England | 50.0 /100 | #174 | Average 12.2% |
| Immigrants | St. Vincent and the Grenadines | 49.7 /100 | #175 | Average 12.2% |
| Immigrants | Guyana | 43.1 /100 | #176 | Average 12.2% |
| Immigrants | Ghana | 42.5 /100 | #177 | Average 12.2% |
| Immigrants | Western Europe | 40.9 /100 | #178 | Average 12.2% |
Demographics Similar to Immigrants from Kenya by Female Disability
In terms of female disability, the demographic groups most similar to Immigrants from Kenya are Nigerian (12.0%, a difference of 0.070%), Greek (12.0%, a difference of 0.070%), Pakistani (12.0%, a difference of 0.11%), Immigrants from Moldova (12.0%, a difference of 0.11%), and Icelander (12.0%, a difference of 0.15%).
| Demographics | Rating | Rank | Female Disability |
| Immigrants | Ecuador | 91.5 /100 | #141 | Exceptional 11.9% |
| Immigrants | Africa | 90.0 /100 | #142 | Excellent 11.9% |
| Immigrants | Sudan | 89.6 /100 | #143 | Excellent 11.9% |
| Immigrants | Austria | 87.9 /100 | #144 | Excellent 12.0% |
| Estonians | 87.8 /100 | #145 | Excellent 12.0% |
| Pakistanis | 84.6 /100 | #146 | Excellent 12.0% |
| Nigerians | 84.0 /100 | #147 | Excellent 12.0% |
| Immigrants | Kenya | 83.1 /100 | #148 | Excellent 12.0% |
| Greeks | 82.0 /100 | #149 | Excellent 12.0% |
| Immigrants | Moldova | 81.4 /100 | #150 | Excellent 12.0% |
| Icelanders | 80.7 /100 | #151 | Excellent 12.0% |
| Immigrants | Scotland | 79.3 /100 | #152 | Good 12.0% |
| Sudanese | 79.1 /100 | #153 | Good 12.0% |
| Syrians | 76.9 /100 | #154 | Good 12.1% |
| Ghanaians | 76.6 /100 | #155 | Good 12.1% |