Immigrants from South Eastern Asia vs West Indian Single Female Poverty
COMPARE
Immigrants from South Eastern Asia
West Indian
Single Female Poverty
Single Female Poverty Comparison
Immigrants from South Eastern Asia
West Indians
19.3%
SINGLE FEMALE POVERTY
99.4/ 100
METRIC RATING
71st/ 347
METRIC RANK
22.3%
SINGLE FEMALE POVERTY
1.9/ 100
METRIC RATING
243rd/ 347
METRIC RANK
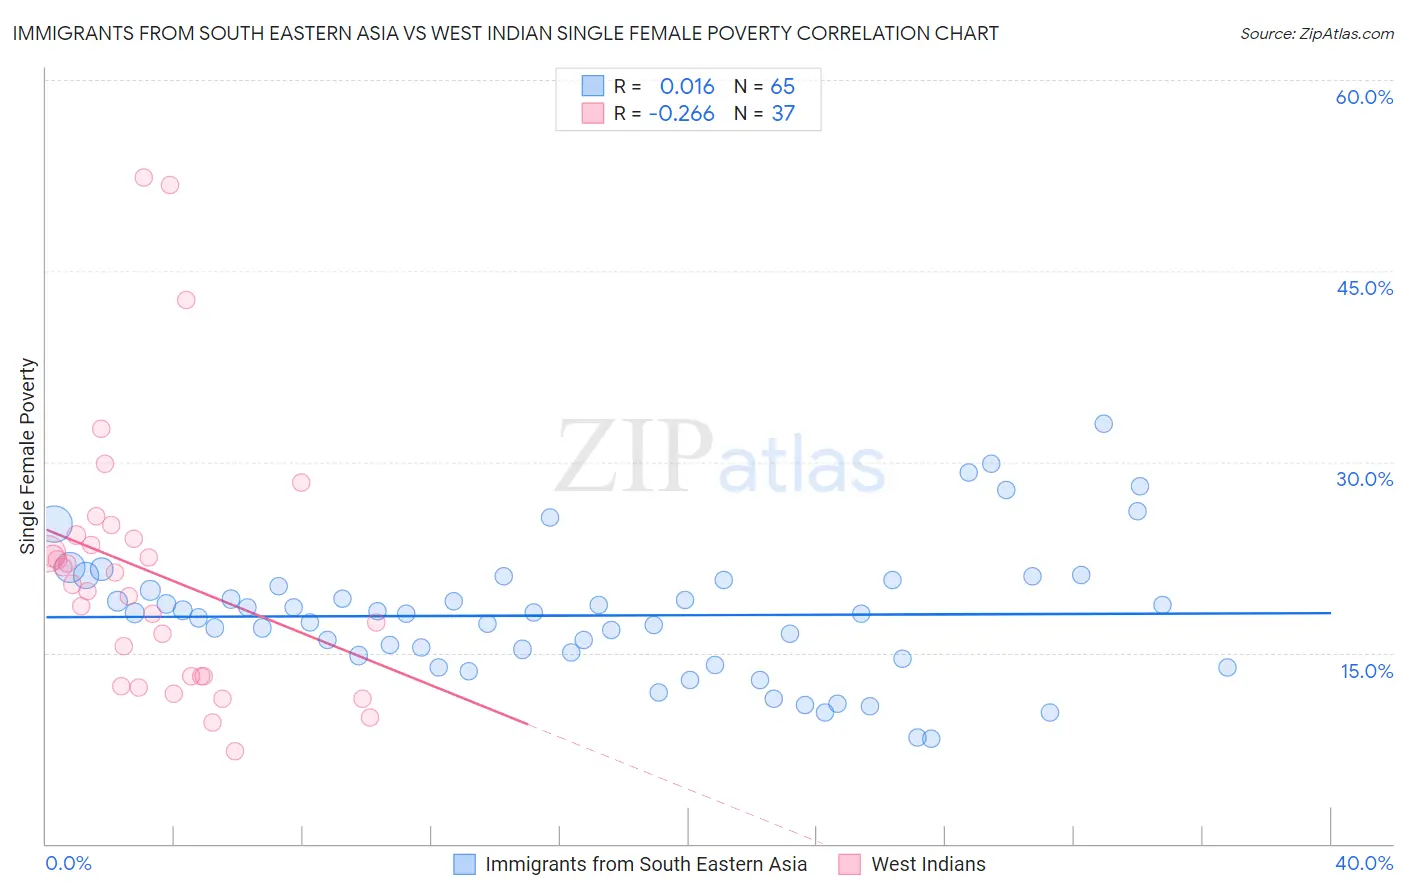
Immigrants from South Eastern Asia vs West Indian Single Female Poverty Correlation Chart
The statistical analysis conducted on geographies consisting of 500,482,626 people shows no correlation between the proportion of Immigrants from South Eastern Asia and poverty level among single females in the United States with a correlation coefficient (R) of 0.016 and weighted average of 19.3%. Similarly, the statistical analysis conducted on geographies consisting of 252,099,029 people shows a weak negative correlation between the proportion of West Indians and poverty level among single females in the United States with a correlation coefficient (R) of -0.266 and weighted average of 22.3%, a difference of 15.4%.
Single Female Poverty Correlation Summary
| Measurement | Immigrants from South Eastern Asia | West Indian |
| Minimum | 8.3% | 7.2% |
| Maximum | 33.0% | 52.4% |
| Range | 24.7% | 45.1% |
| Mean | 17.9% | 21.3% |
| Median | 18.0% | 20.4% |
| Interquartile 25% (IQ1) | 14.7% | 13.2% |
| Interquartile 75% (IQ3) | 20.4% | 24.1% |
| Interquartile Range (IQR) | 5.8% | 10.9% |
| Standard Deviation (Sample) | 5.1% | 10.4% |
| Standard Deviation (Population) | 5.1% | 10.2% |
Similar Demographics by Single Female Poverty
Demographics Similar to Immigrants from South Eastern Asia by Single Female Poverty
In terms of single female poverty, the demographic groups most similar to Immigrants from South Eastern Asia are Immigrants from Latvia (19.3%, a difference of 0.0%), Immigrants from Jordan (19.3%, a difference of 0.070%), Immigrants from Peru (19.3%, a difference of 0.10%), Immigrants from Belarus (19.3%, a difference of 0.12%), and Paraguayan (19.3%, a difference of 0.13%).
| Demographics | Rating | Rank | Single Female Poverty |
| Immigrants | Europe | 99.6 /100 | #64 | Exceptional 19.2% |
| Cypriots | 99.6 /100 | #65 | Exceptional 19.2% |
| Palestinians | 99.6 /100 | #66 | Exceptional 19.2% |
| Immigrants | Egypt | 99.6 /100 | #67 | Exceptional 19.2% |
| Laotians | 99.5 /100 | #68 | Exceptional 19.3% |
| Paraguayans | 99.5 /100 | #69 | Exceptional 19.3% |
| Immigrants | Jordan | 99.4 /100 | #70 | Exceptional 19.3% |
| Immigrants | South Eastern Asia | 99.4 /100 | #71 | Exceptional 19.3% |
| Immigrants | Latvia | 99.4 /100 | #72 | Exceptional 19.3% |
| Immigrants | Peru | 99.4 /100 | #73 | Exceptional 19.3% |
| Immigrants | Belarus | 99.4 /100 | #74 | Exceptional 19.3% |
| Immigrants | Turkey | 99.4 /100 | #75 | Exceptional 19.4% |
| Peruvians | 99.4 /100 | #76 | Exceptional 19.4% |
| Immigrants | Russia | 99.3 /100 | #77 | Exceptional 19.4% |
| Albanians | 99.3 /100 | #78 | Exceptional 19.4% |
Demographics Similar to West Indians by Single Female Poverty
In terms of single female poverty, the demographic groups most similar to West Indians are Immigrants from Middle Africa (22.3%, a difference of 0.010%), Immigrants from Bangladesh (22.3%, a difference of 0.050%), Bermudan (22.3%, a difference of 0.090%), Cape Verdean (22.3%, a difference of 0.16%), and French (22.2%, a difference of 0.30%).
| Demographics | Rating | Rank | Single Female Poverty |
| Immigrants | Ecuador | 4.2 /100 | #236 | Tragic 22.0% |
| Vietnamese | 4.0 /100 | #237 | Tragic 22.0% |
| French Canadians | 2.8 /100 | #238 | Tragic 22.2% |
| Malaysians | 2.8 /100 | #239 | Tragic 22.2% |
| French | 2.3 /100 | #240 | Tragic 22.2% |
| Cape Verdeans | 2.1 /100 | #241 | Tragic 22.3% |
| Bermudans | 2.0 /100 | #242 | Tragic 22.3% |
| West Indians | 1.9 /100 | #243 | Tragic 22.3% |
| Immigrants | Middle Africa | 1.9 /100 | #244 | Tragic 22.3% |
| Immigrants | Bangladesh | 1.8 /100 | #245 | Tragic 22.3% |
| Liberians | 1.4 /100 | #246 | Tragic 22.4% |
| Immigrants | El Salvador | 1.4 /100 | #247 | Tragic 22.4% |
| Belizeans | 1.4 /100 | #248 | Tragic 22.4% |
| Immigrants | Caribbean | 1.3 /100 | #249 | Tragic 22.4% |
| Immigrants | Bahamas | 1.2 /100 | #250 | Tragic 22.5% |