Immigrants from South Eastern Asia vs Native/Alaskan Median Earnings
COMPARE
Immigrants from South Eastern Asia
Native/Alaskan
Median Earnings
Median Earnings Comparison
Immigrants from South Eastern Asia
Natives/Alaskans
$47,671
MEDIAN EARNINGS
85.0/ 100
METRIC RATING
147th/ 347
METRIC RANK
$38,896
MEDIAN EARNINGS
0.0/ 100
METRIC RATING
335th/ 347
METRIC RANK
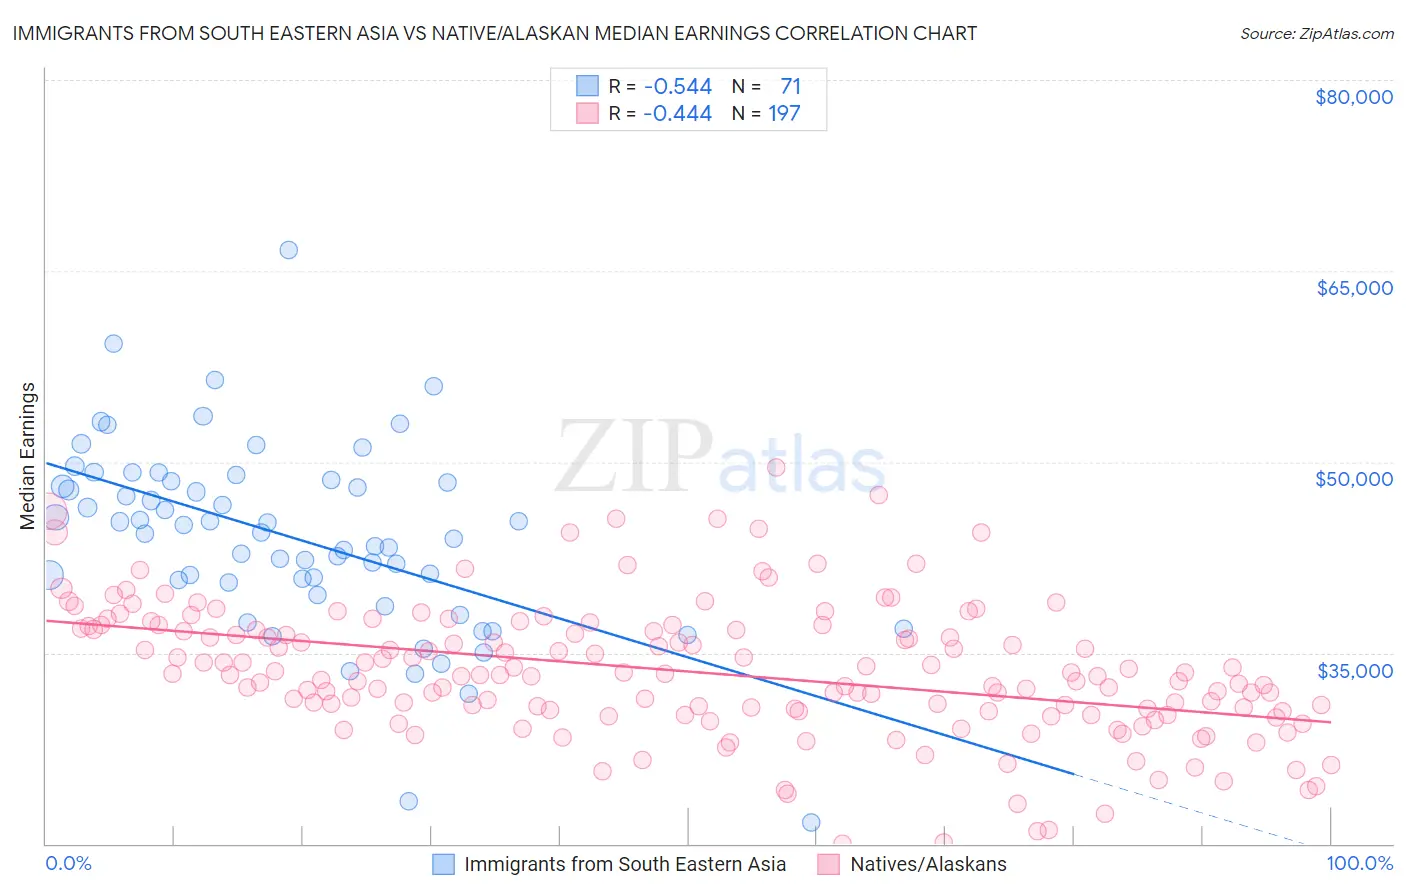
Immigrants from South Eastern Asia vs Native/Alaskan Median Earnings Correlation Chart
The statistical analysis conducted on geographies consisting of 512,554,349 people shows a substantial negative correlation between the proportion of Immigrants from South Eastern Asia and median earnings in the United States with a correlation coefficient (R) of -0.544 and weighted average of $47,671. Similarly, the statistical analysis conducted on geographies consisting of 512,831,083 people shows a moderate negative correlation between the proportion of Natives/Alaskans and median earnings in the United States with a correlation coefficient (R) of -0.444 and weighted average of $38,896, a difference of 22.6%.
Median Earnings Correlation Summary
| Measurement | Immigrants from South Eastern Asia | Native/Alaskan |
| Minimum | $21,667 | $20,036 |
| Maximum | $66,617 | $49,581 |
| Range | $44,950 | $29,544 |
| Mean | $44,037 | $33,526 |
| Median | $44,467 | $33,302 |
| Interquartile 25% (IQ1) | $40,525 | $30,416 |
| Interquartile 75% (IQ3) | $48,439 | $36,881 |
| Interquartile Range (IQR) | $7,914 | $6,465 |
| Standard Deviation (Sample) | $7,447 | $5,244 |
| Standard Deviation (Population) | $7,395 | $5,231 |
Similar Demographics by Median Earnings
Demographics Similar to Immigrants from South Eastern Asia by Median Earnings
In terms of median earnings, the demographic groups most similar to Immigrants from South Eastern Asia are Immigrants from Eritrea ($47,657, a difference of 0.030%), Immigrants from Chile ($47,697, a difference of 0.060%), Luxembourger ($47,640, a difference of 0.060%), Immigrants from Saudi Arabia ($47,704, a difference of 0.070%), and Peruvian ($47,628, a difference of 0.090%).
| Demographics | Rating | Rank | Median Earnings |
| Taiwanese | 88.7 /100 | #140 | Excellent $47,902 |
| Immigrants | Sierra Leone | 88.3 /100 | #141 | Excellent $47,875 |
| Ugandans | 88.0 /100 | #142 | Excellent $47,854 |
| Swedes | 88.0 /100 | #143 | Excellent $47,851 |
| Hungarians | 87.1 /100 | #144 | Excellent $47,795 |
| Immigrants | Saudi Arabia | 85.6 /100 | #145 | Excellent $47,704 |
| Immigrants | Chile | 85.5 /100 | #146 | Excellent $47,697 |
| Immigrants | South Eastern Asia | 85.0 /100 | #147 | Excellent $47,671 |
| Immigrants | Eritrea | 84.8 /100 | #148 | Excellent $47,657 |
| Luxembourgers | 84.5 /100 | #149 | Excellent $47,640 |
| Peruvians | 84.2 /100 | #150 | Excellent $47,628 |
| Immigrants | Oceania | 84.1 /100 | #151 | Excellent $47,617 |
| Immigrants | Germany | 83.1 /100 | #152 | Excellent $47,566 |
| Slavs | 81.1 /100 | #153 | Excellent $47,470 |
| Immigrants | Portugal | 77.3 /100 | #154 | Good $47,304 |
Demographics Similar to Natives/Alaskans by Median Earnings
In terms of median earnings, the demographic groups most similar to Natives/Alaskans are Spanish American Indian ($38,907, a difference of 0.030%), Houma ($38,949, a difference of 0.14%), Crow ($38,707, a difference of 0.49%), Yakama ($39,107, a difference of 0.54%), and Immigrants from Mexico ($39,114, a difference of 0.56%).
| Demographics | Rating | Rank | Median Earnings |
| Sioux | 0.0 /100 | #328 | Tragic $39,448 |
| Kiowa | 0.0 /100 | #329 | Tragic $39,232 |
| Immigrants | Congo | 0.0 /100 | #330 | Tragic $39,169 |
| Immigrants | Mexico | 0.0 /100 | #331 | Tragic $39,114 |
| Yakama | 0.0 /100 | #332 | Tragic $39,107 |
| Houma | 0.0 /100 | #333 | Tragic $38,949 |
| Spanish American Indians | 0.0 /100 | #334 | Tragic $38,907 |
| Natives/Alaskans | 0.0 /100 | #335 | Tragic $38,896 |
| Crow | 0.0 /100 | #336 | Tragic $38,707 |
| Immigrants | Cuba | 0.0 /100 | #337 | Tragic $38,426 |
| Pima | 0.0 /100 | #338 | Tragic $38,285 |
| Menominee | 0.0 /100 | #339 | Tragic $37,884 |
| Navajo | 0.0 /100 | #340 | Tragic $36,999 |
| Lumbee | 0.0 /100 | #341 | Tragic $36,876 |
| Hopi | 0.0 /100 | #342 | Tragic $36,871 |