Immigrants from South Central Asia vs Jordanian Family Poverty
COMPARE
Immigrants from South Central Asia
Jordanian
Family Poverty
Family Poverty Comparison
Immigrants from South Central Asia
Jordanians
7.2%
FAMILY POVERTY
99.8/ 100
METRIC RATING
16th/ 347
METRIC RANK
8.2%
FAMILY POVERTY
94.8/ 100
METRIC RATING
109th/ 347
METRIC RANK
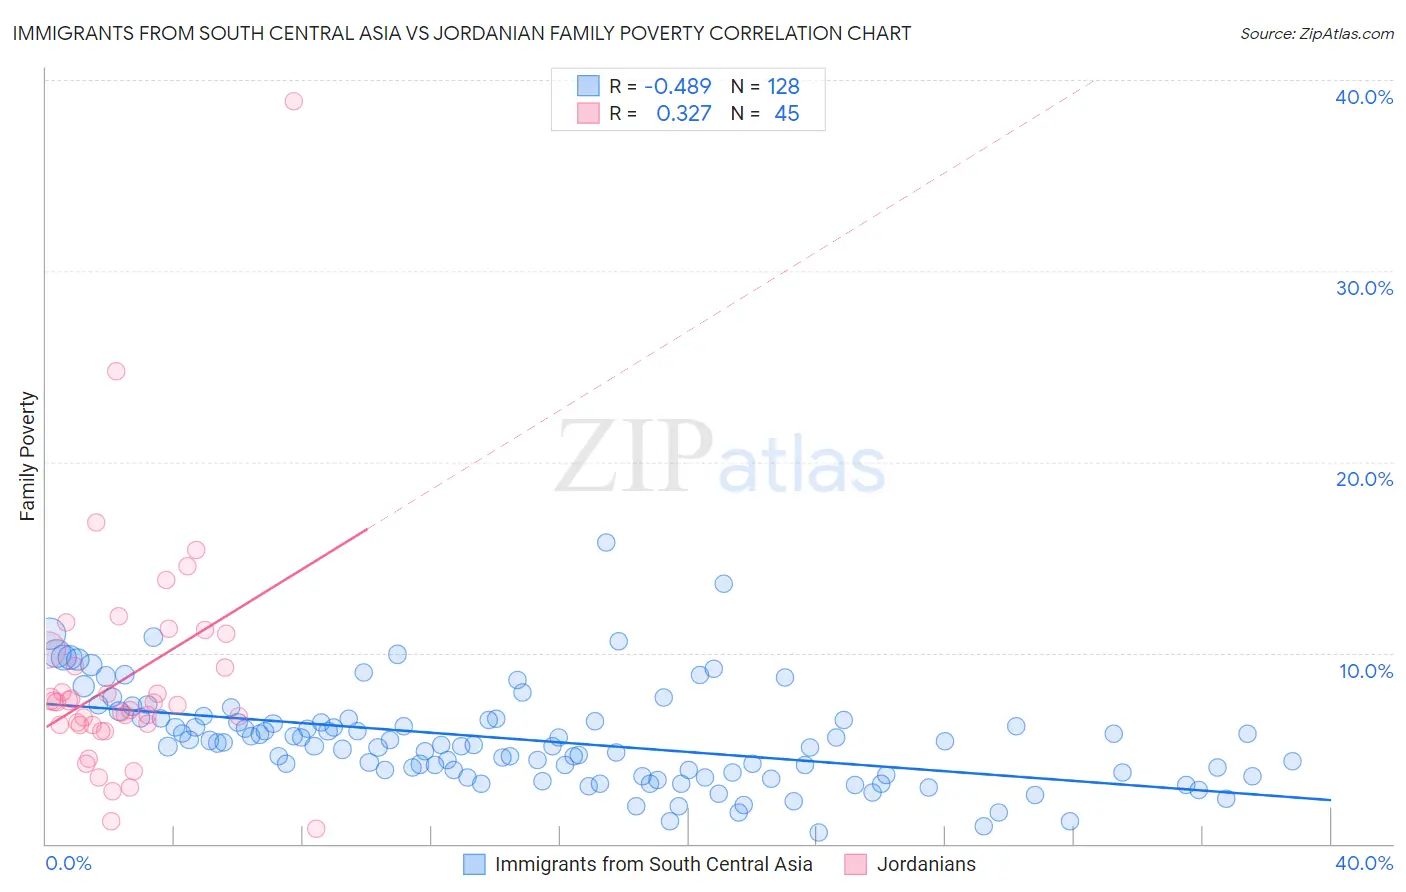
Immigrants from South Central Asia vs Jordanian Family Poverty Correlation Chart
The statistical analysis conducted on geographies consisting of 471,025,257 people shows a moderate negative correlation between the proportion of Immigrants from South Central Asia and poverty level among families in the United States with a correlation coefficient (R) of -0.489 and weighted average of 7.2%. Similarly, the statistical analysis conducted on geographies consisting of 166,331,422 people shows a mild positive correlation between the proportion of Jordanians and poverty level among families in the United States with a correlation coefficient (R) of 0.327 and weighted average of 8.2%, a difference of 13.2%.
Family Poverty Correlation Summary
| Measurement | Immigrants from South Central Asia | Jordanian |
| Minimum | 0.60% | 0.81% |
| Maximum | 15.8% | 38.9% |
| Range | 15.2% | 38.1% |
| Mean | 5.4% | 8.7% |
| Median | 5.2% | 7.4% |
| Interquartile 25% (IQ1) | 3.7% | 6.2% |
| Interquartile 75% (IQ3) | 6.5% | 10.6% |
| Interquartile Range (IQR) | 2.9% | 4.3% |
| Standard Deviation (Sample) | 2.5% | 6.3% |
| Standard Deviation (Population) | 2.5% | 6.2% |
Similar Demographics by Family Poverty
Demographics Similar to Immigrants from South Central Asia by Family Poverty
In terms of family poverty, the demographic groups most similar to Immigrants from South Central Asia are Luxembourger (7.2%, a difference of 0.22%), Immigrants from Lithuania (7.2%, a difference of 0.24%), Lithuanian (7.2%, a difference of 0.27%), Eastern European (7.2%, a difference of 0.54%), and Immigrants from Hong Kong (7.3%, a difference of 0.70%).
| Demographics | Rating | Rank | Family Poverty |
| Latvians | 99.9 /100 | #9 | Exceptional 7.1% |
| Bulgarians | 99.8 /100 | #10 | Exceptional 7.1% |
| Immigrants | Singapore | 99.8 /100 | #11 | Exceptional 7.1% |
| Maltese | 99.8 /100 | #12 | Exceptional 7.1% |
| Swedes | 99.8 /100 | #13 | Exceptional 7.1% |
| Iranians | 99.8 /100 | #14 | Exceptional 7.1% |
| Lithuanians | 99.8 /100 | #15 | Exceptional 7.2% |
| Immigrants | South Central Asia | 99.8 /100 | #16 | Exceptional 7.2% |
| Luxembourgers | 99.8 /100 | #17 | Exceptional 7.2% |
| Immigrants | Lithuania | 99.8 /100 | #18 | Exceptional 7.2% |
| Eastern Europeans | 99.7 /100 | #19 | Exceptional 7.2% |
| Immigrants | Hong Kong | 99.7 /100 | #20 | Exceptional 7.3% |
| Immigrants | Iran | 99.7 /100 | #21 | Exceptional 7.3% |
| Danes | 99.7 /100 | #22 | Exceptional 7.3% |
| Assyrians/Chaldeans/Syriacs | 99.7 /100 | #23 | Exceptional 7.3% |
Demographics Similar to Jordanians by Family Poverty
In terms of family poverty, the demographic groups most similar to Jordanians are Basque (8.1%, a difference of 0.090%), Romanian (8.2%, a difference of 0.090%), Taiwanese (8.2%, a difference of 0.15%), French Canadian (8.1%, a difference of 0.18%), and Egyptian (8.1%, a difference of 0.22%).
| Demographics | Rating | Rank | Family Poverty |
| Immigrants | Indonesia | 95.7 /100 | #102 | Exceptional 8.1% |
| Immigrants | Eastern Europe | 95.6 /100 | #103 | Exceptional 8.1% |
| Slavs | 95.6 /100 | #104 | Exceptional 8.1% |
| Laotians | 95.6 /100 | #105 | Exceptional 8.1% |
| Egyptians | 95.1 /100 | #106 | Exceptional 8.1% |
| French Canadians | 95.0 /100 | #107 | Exceptional 8.1% |
| Basques | 94.9 /100 | #108 | Exceptional 8.1% |
| Jordanians | 94.8 /100 | #109 | Exceptional 8.2% |
| Romanians | 94.7 /100 | #110 | Exceptional 8.2% |
| Taiwanese | 94.6 /100 | #111 | Exceptional 8.2% |
| Immigrants | France | 94.4 /100 | #112 | Exceptional 8.2% |
| Canadians | 94.2 /100 | #113 | Exceptional 8.2% |
| Immigrants | Zimbabwe | 94.0 /100 | #114 | Exceptional 8.2% |
| Immigrants | Israel | 93.5 /100 | #115 | Exceptional 8.2% |
| South Africans | 93.4 /100 | #116 | Exceptional 8.2% |